Getting Started with AnomIQ The Real-Time Crypto Anomaly Scanner
If you are waiting for a 15-minute candle to close before entering a trade, you are already too late. In crypto, institutional capital and algorithmic bots execute in milliseconds. By the time traditional indicators like RSI or MACD trigger an alert, the move has already happened.
AnomIQ was built to solve this exact problem.
Instead of waiting for arbitrary timeframes to close, AnomIQ ingests raw WebSocket trade data from Binance and Coinbase, running it through continuous “rolling windows.” This allows us to detect volume surges, whale executions, and liquidity shifts the exact second they happen.
Here are the three ways you can start using AnomIQ today to find your edge in the market.
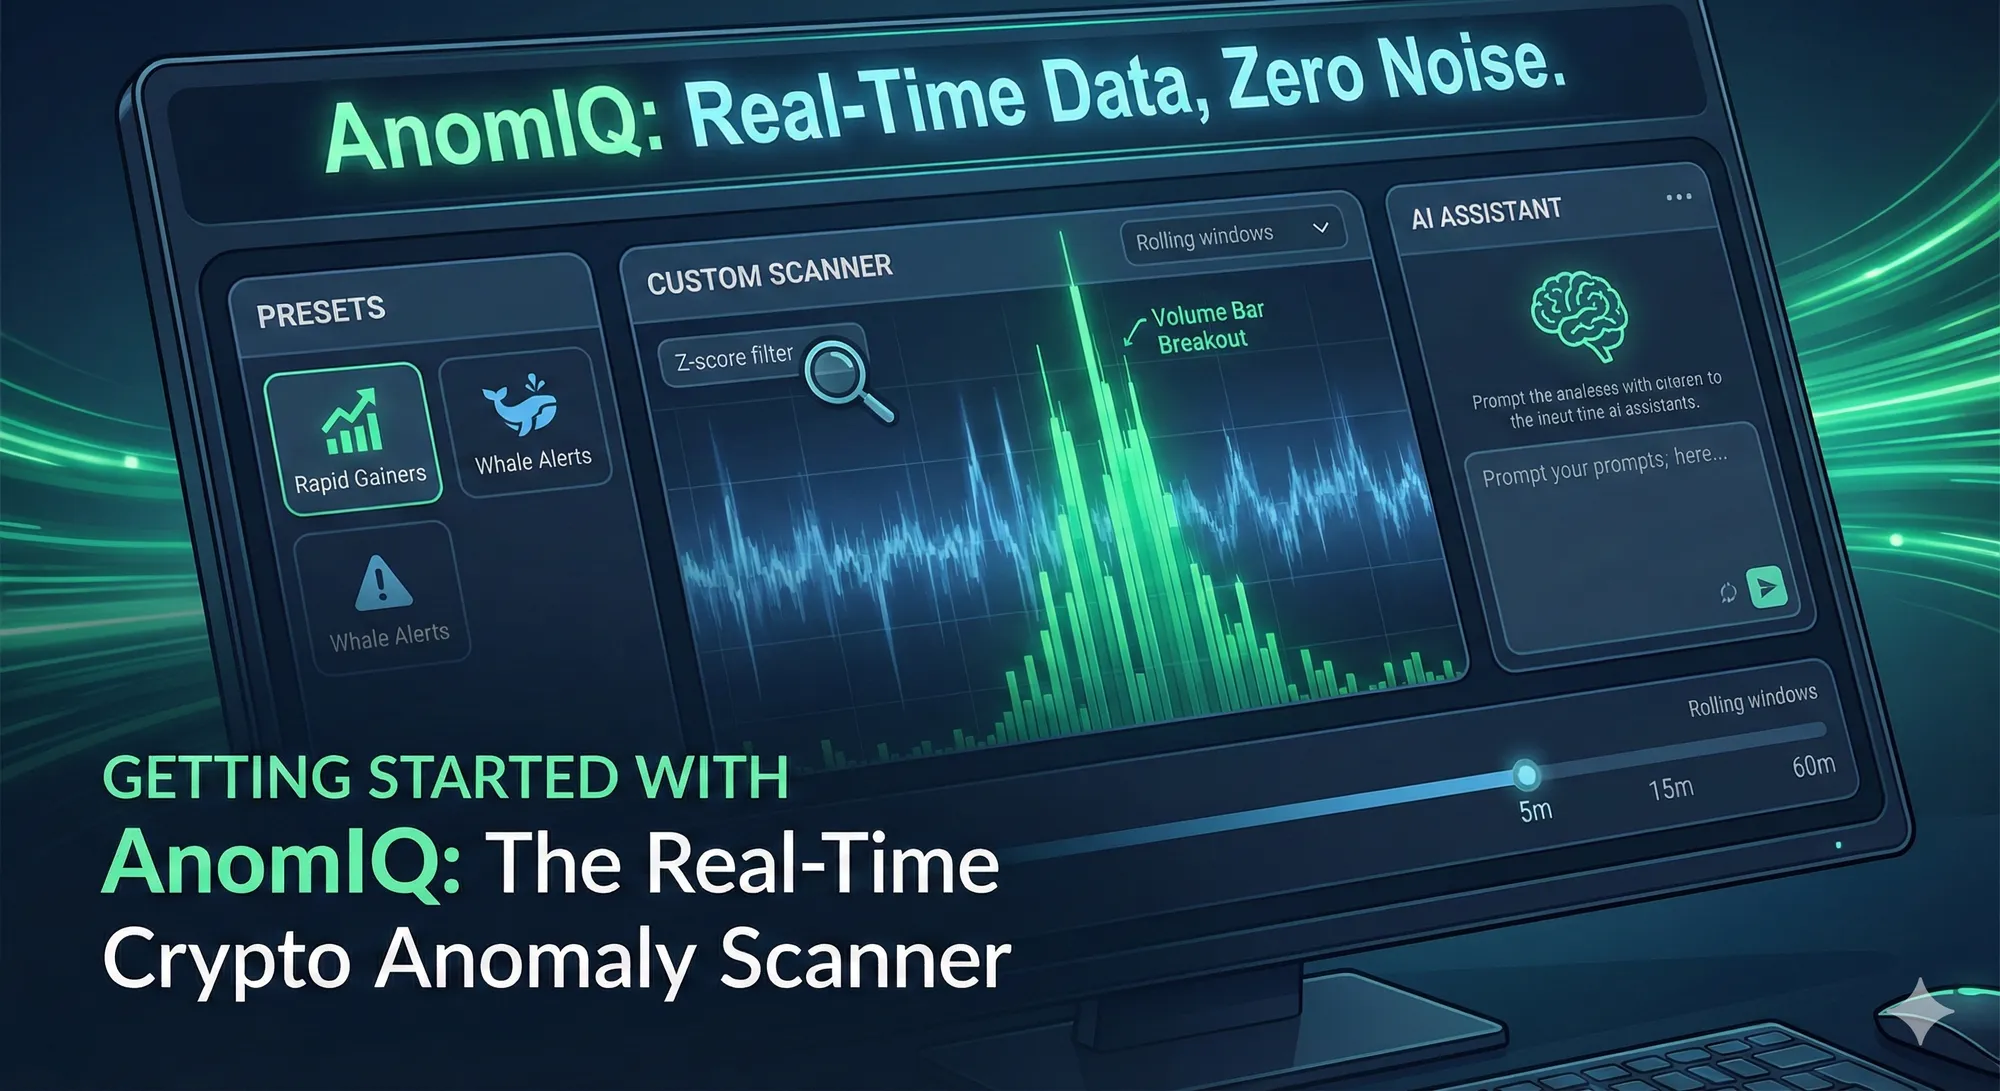
1. The Quick Start: Pre-Built Scanners
If you want to jump straight into the action, AnomIQ comes loaded with highly tuned, pre-built scanners designed by professional traders. These presets instantly filter thousands of coins down to the exact setups you are looking for.
Popular presets include:
- Rapid Gainers: Catches coins experiencing sudden, micro-timeframe price and volume explosions.
- Volume Ignition: Flags assets where the current 5-minute volume is trading over 300% hotter than its historical baseline.
- Iceberg Accumulation: Uses our proprietary Intensity Z-Score to detect when large institutional orders (whales) are absorbing retail sell pressure.
Simply click a preset, and the dashboard will instantly populate with live, verified alerts.
2. The Pro Route: Custom Multi-Timeframe Filters
For advanced traders, AnomIQ acts as a blank canvas. You can build the ultimate custom screener by stacking dozens of highly specific data points across multiple timeframes (5m, 15m, and 60m).
Want to find a specific setup? You can mix and match parameters like:
- Statistical Rarity: Set
Volume Z-Score > 3.0to only see the top 0.3% of market events. - Order Flow Bias: Set
Buy Volume Ratio > 65%to ensure buyers are aggressively lifting the offer. - Safety Nets: Use our
Liquidity Score > 80to completely filter out dead, illiquid, or highly manipulated tokens.
Because you can combine timeframes, you can set a filter that demands a 5-minute volume explosion backed by a 60-minute bullish trend, ensuring you don’t buy into a fakeout.
3. The AI Shortcut: Translate Your Strategy into Filters
Not sure exactly which Z-scores or volume ratios match the trading strategy in your head? Let AI do the heavy lifting for you.
We have created a “Master Prompt” that you can copy and paste into ChatGPT, Claude, or Gemini. It feeds the AI the exact mathematical models AnomIQ uses. Just fill in your strategy at the top, and the AI will tell you exactly how to set up your scanner.
Copy and paste this entire block into your favorite AI:
Strategy: Here is my trading strategy: [INSERT YOUR PLAIN ENGLISH STRATEGY HERE - e.g., “I like to buy small-cap altcoins right when a massive whale starts buying, but only if the coin has been dead quiet for the last hour.”]
Context: I use a real-time crypto scanner called AnomIQ. It does not wait for candles to close. It processes raw trades using zero-lag rolling windows (e.g., a 5m window is 4 finished 1m bars + 1 active bar).
I need to build a scanner using these available filters: 1. Global Daily Metrics: Market (Binance/Coinbase), Current Price ($), Today Return (%), Today Volume ($), Volume Ratio Relative (compares today’s volume to yesterday at this exact time), Liquidity Score (0-100, >30 is alive, >80 is highly liquid), Acceleration Micro (5m vol / 15m vol), and Acceleration Macro (5m vol / 60m vol). 2. Timeframe Specific Metrics (Available individually for 5m, 15m, and 60m rolling windows):
- Historical Ratios: Total/Buy/Sell Volume Ratio (e.g., 200% = 2x normal volume), Total/Buy/Sell Trade Count Ratio, Total/Buy/Sell Trade Size Ratio.
- Current Window Dominance: Current Buy Volume Ratio (>50% means buyers dominate the flow), Current Buy Trades Ratio, Current Move (Return %).
- Statistical Rarity (Z-Scores): Volume Z-Score, Buy/Sell Volume Z-Score, Trade Count Z-Score, Trade Size Z-Score. (Note: Z-scores > 2.5 are highly abnormal, > 3.0 is the top 0.3% of activity).
- Whale Detection: Intensity Z-Score (The primary whale score. > 2.0 means volume is rising much faster than trade count = institutional size. Negative values = retail/bots). Intensity Ratio (current avg trade size vs historical). Volatility (%).
Job: Based on my strategy, exactly which AnomIQ filters and timeframes should I set to build the perfect scanner? Provide the exact metric names and the > or < thresholds I should input.
Start Scanning Now
The market doesn’t wait for lagging indicators, and neither should you. AnomIQ is currently in a free Early Access phase.
Launch the dashboard, pick a preset or build your own, and start trading the data instead of the noise.