
We scan the markets.
You get notified.
Real-time statistical anomaly monitoring for digital asset markets. Customize multi-timeframe filters to track institutional order flow and tick-level market data across major exchanges.
Connected Exchanges
4 exchanges · 500+ assets monitored
What is AnomIQ?
AnomIQ scans cryptocurrency markets for statistical anomalies in real time. It pulls tick-level trade data from Binance spot and perps, Coinbase, and Hyperliquid, computes rolling Z-scores against each asset's own baseline, and surfaces coins showing unusual volume, order flow, or taker imbalance across 5m, 15m, and 60m windows. Thresholds adapt to each asset's history, so signals fire as activity develops rather than after a candle closes.
Monitor Markets as They Move
Live metrics across 5m, 15m, and 60m rolling windows computed from tick-level trade data. Signals fire as activity develops — no candle close required.
Detect Institutional Order Flow
The Intensity Z-Score fires when volume grows faster than trade count — a signature of high-conviction institutional flow distinct from retail activity.
Spot Volume Anomalies Instantly
Compare live volume to yesterday's same-minute baseline. Assets trading above their historical norm surface immediately, regardless of price direction.
Filter Across Multiple Timeframes
Mix timeframes in a single scanner. Find assets with a 5m volume spike backed by sustained 60m institutional order flow, then let it run while you sleep.
Score Liquidity Before You Trade
The 0–100 Liquidity Score measures 24-hour trading consistency to filter for markets with measurable execution depth before a scanner alert fires.
Isolate the Top 0.3% of Market Events
Z-Scores across volume, trade count, and average size surface only the most extreme activity from background noise across every listed asset.
Tick-Level Market Data Scanners
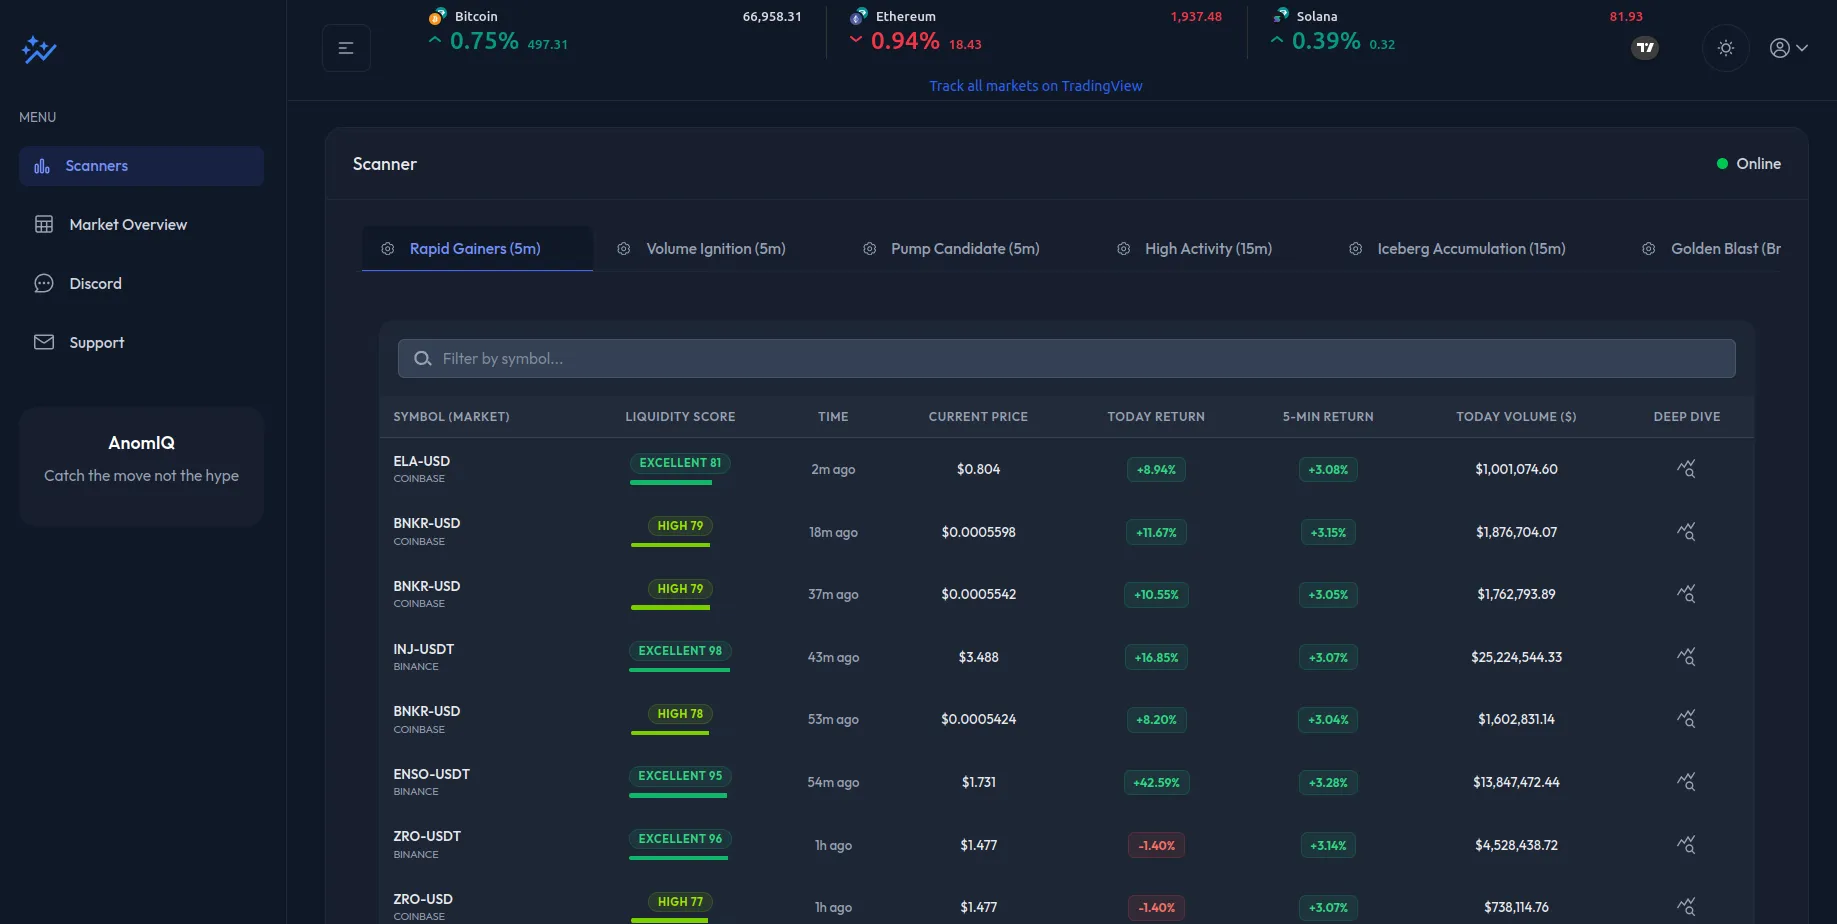
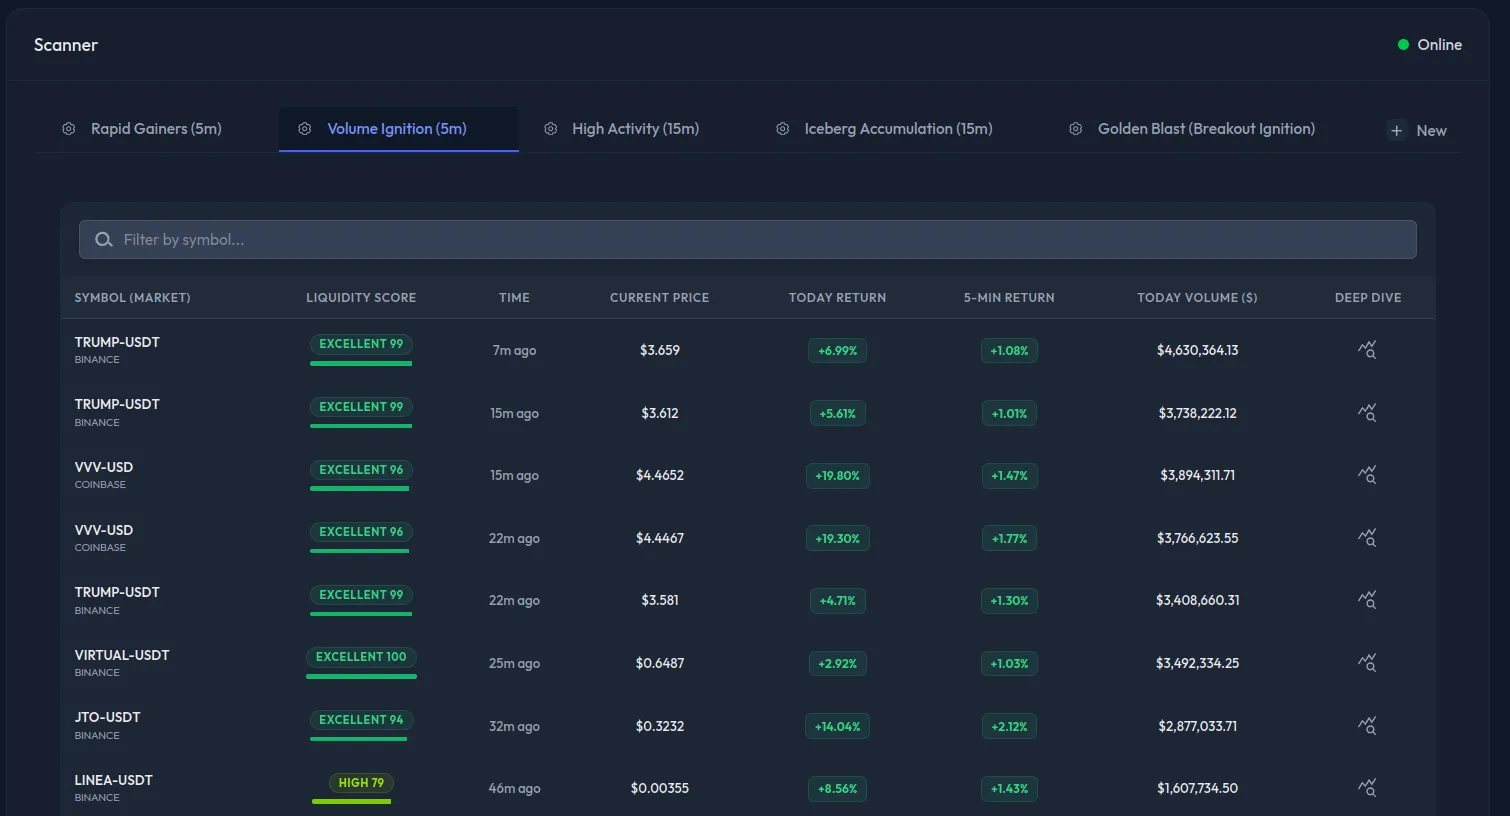
Pre-built algorithms like Rapid Gainers, Volume Ignition, and Iceberg Accumulation are ready on first login. Monitor tick-level market data, track Liquidity Scores, and filter across all listed assets to match your exact parameters.
Institutional Order Flow Monitoring
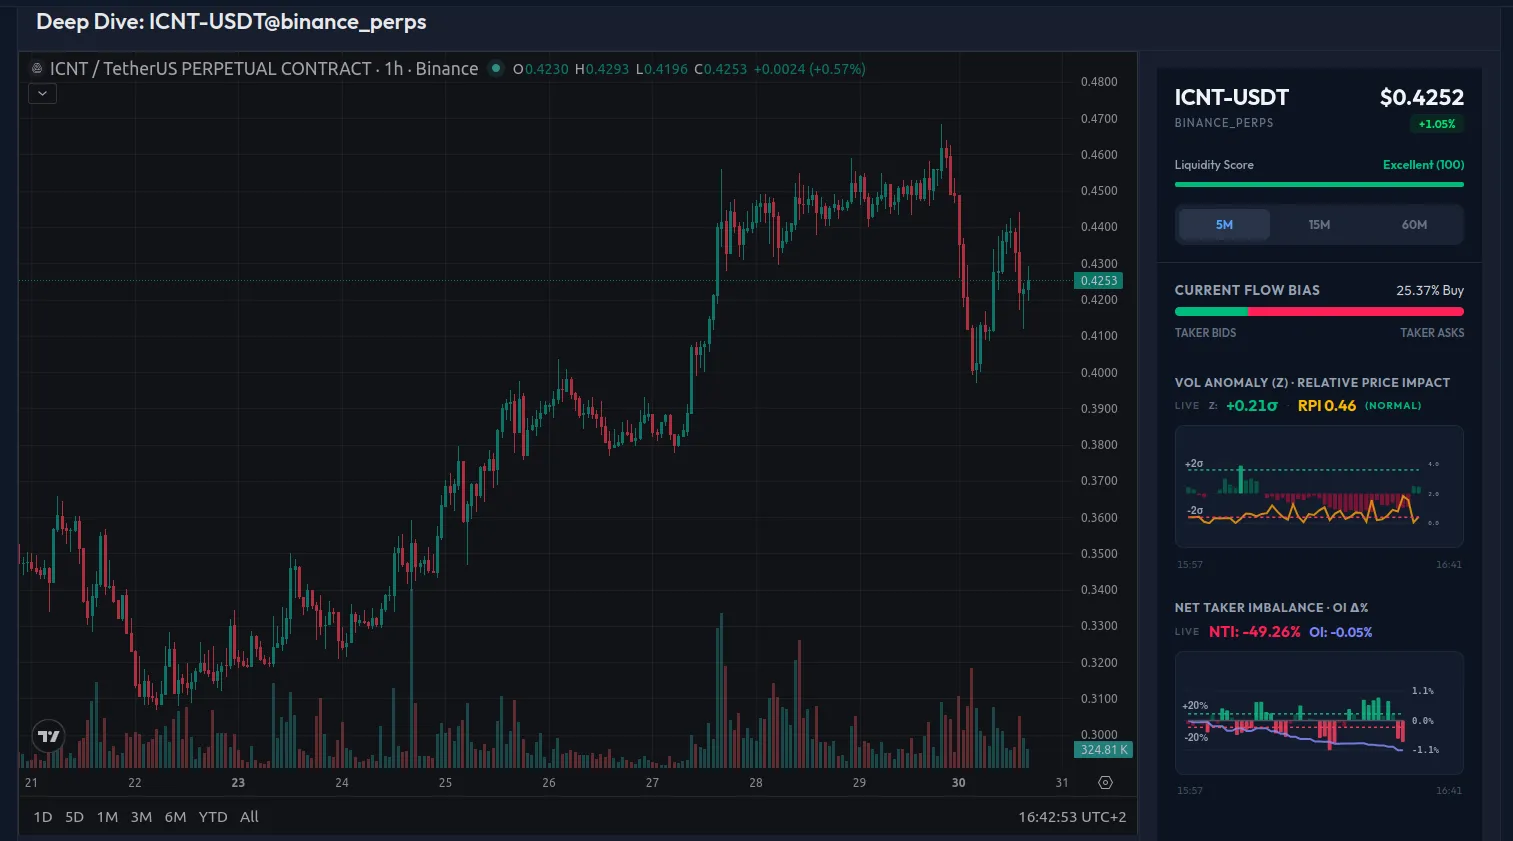
When a scanner fires, open the deep dive to evaluate the setup. Historical bar charts for volume z-score, net taker imbalance, and relative price impact show whether the signal held across consecutive rolling windows or peaked once and faded. The 5m tab gives you 45 minutes of context, 15m gives 90, 60m gives 6 hours. Use the embedded TradingView chart to time your entry.
Statistical Anomaly Monitoring at Market Scale
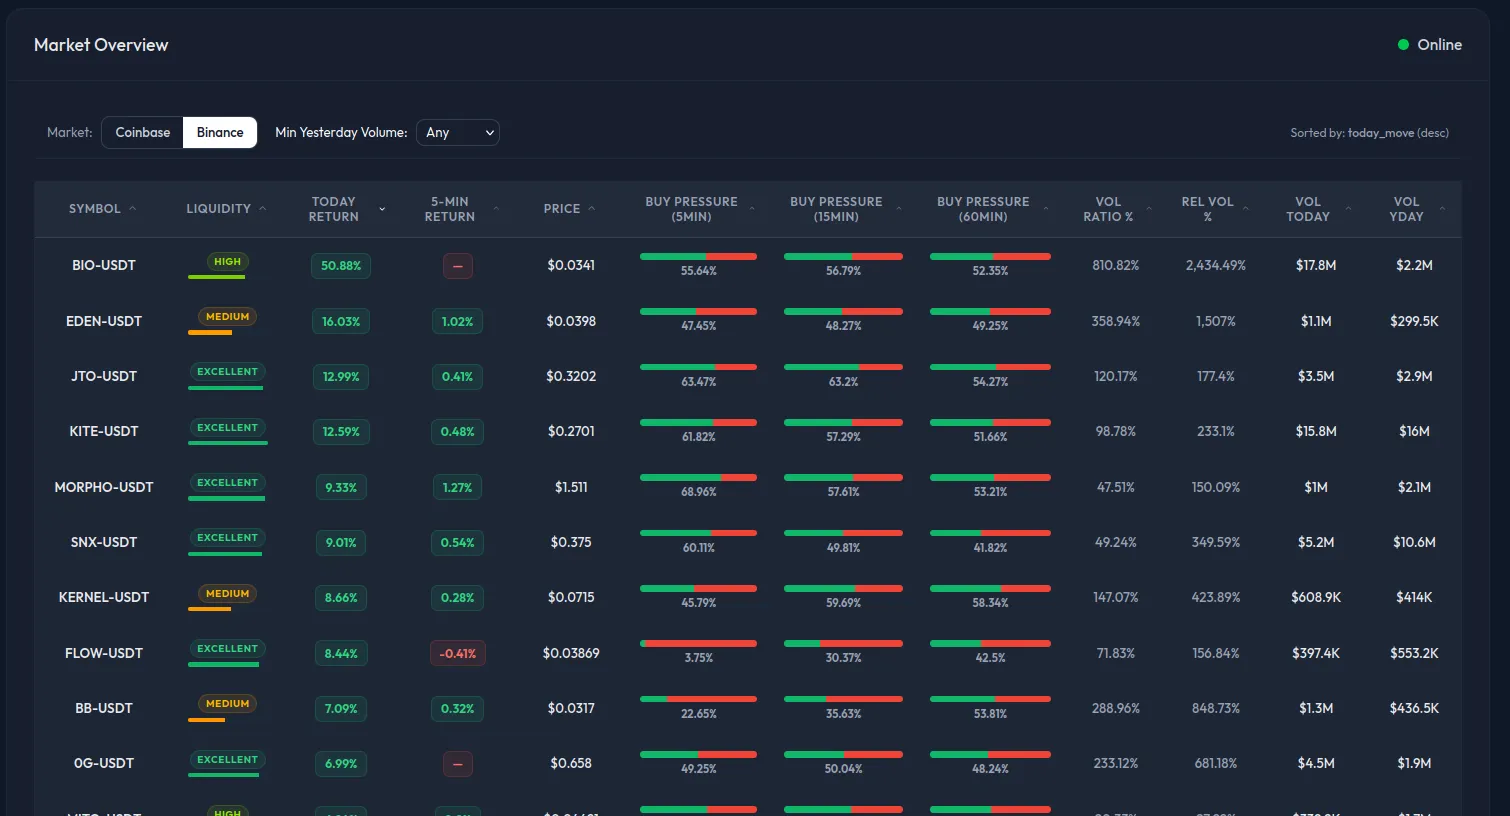
Sort the entire Binance spot, Binance perps, Coinbase, or Hyperliquid market by real-time buy pressure, relative volume, and multi-timeframe returns. Monitor volume distribution and liquidity flow anomalies across every sector simultaneously.
Live Market Feed
Real-time trade processing across 4 exchanges. Every scan sweep refreshes trade counts and open interest live.
| Coin | Price | Day % | OI Change 4H |
|---|---|---|---|
| MAGIC | $0.11574 | +74.12% | +24.61% |
| PIXEL | $0.006445 | +13.19% | +21.72% |
| RLC | $1.0898 | +23.56% | -15.83% |
| ZK | $0.014232 | +25.05% | +14.30% |
| GMT | $0.008782 | +12.02% | +12.71% |
OI data from Binance USDT-margined perpetuals
Open ScannerPricing for Institutional Order Flow Monitoring
Free
Full access to the live terminal. 30-minute delayed data. No credit card required.
(billed monthly)
- Dashboard notifications
- Support for Coinbase spot, Binance spot, Binance perps, and Hyperliquid
- Custom anomaly filters (up to 2)
- Historical anomaly research (20 research runs per 20 days)
- Real time notifications (30-minute delayed)
Pro
Most Popular
Real-time infrastructure for institutional order flow analysis. Includes a 14-day money-back guarantee.
(billed monthly)
- Dashboard notifications
- Support for Coinbase spot, Binance spot, Binance perps, and Hyperliquid
- Custom anomaly filters (Up to 10)
- Historical anomaly research (Unlimited research runs)
- External notifications (Telegram Private Notifications, NTFY mobile app)
- Real time notifications
Features
Dashboard notifications
Support for Coinbase spot, Binance spot, Binance perps, and Hyperliquid
Custom anomaly filters
Historical anomaly research
External notifications (Telegram Private Notifications, NTFY mobile app)
Real time notifications
AnomIQ provides real-time market data and statistical analysis for informational purposes only. Not financial advice.
14-Day Money-Back Guarantee
Try AnomIQ Pro risk-free. If the data engine doesn't fit your trading workflow, email support within 14 days for a full refund. One refund per user.
Institutional Order Flow & Statistical Anomaly Monitoring FAQs
Trade on market microstructure.
Access the live terminal and detect volume anomalies, taker flow imbalance, and institutional order flow before candles close.
14-Day Risk-Free Guarantee