Order Flow Absorption and Exhaustion: How to Tell Them Apart
This is Part 1 of a two-part series.Part 2 covers real market examples with live scanner data and documented price outcomes.
For the broader scanner framework, start with Crypto Order Flow Trading: Taker Flow and Scanner Rules, then use this article for the absorption and exhaustion layer.
That order-flow framework explains how volume z-score, Net Taker Imbalance, Relative Price Impact and liquidity gates combine before you label a setup as absorption or exhaustion.
A common oversimplification in market analysis: strong buy volume means price is going up, and strong sell volume means price is going down.
In modern, algorithmically driven markets, this assumption is often a trap. When you see a massive spike in aggressive volume, it does not guarantee continuation. In fact, some of the highest volume prints occur exactly at the moment a trend dies.
Unusual activity alone tells you nothing. You must understand how the market is reacting to that activity.
Understanding the microstructure concepts of Absorption and Exhaustion is what adds context to any raw anomaly signal.
The Problem: Aggression Without Progress
Traders who rely solely on basic volume indicators or fast tape reading often get fooled by the speed of the market. They see a flurry of green market buys and assume a breakout is imminent.
But order flow requires context. If aggressive buyers are throwing millions of dollars at the market, but the price is barely moving, you are witnessing aggression without progress.
This happens because market microstructure is a two-sided mechanism: Aggressive Taker Flow (market orders) against Passive Liquidity (limit orders).
Defining the Difference
Before we can scan for these events, we must define them:
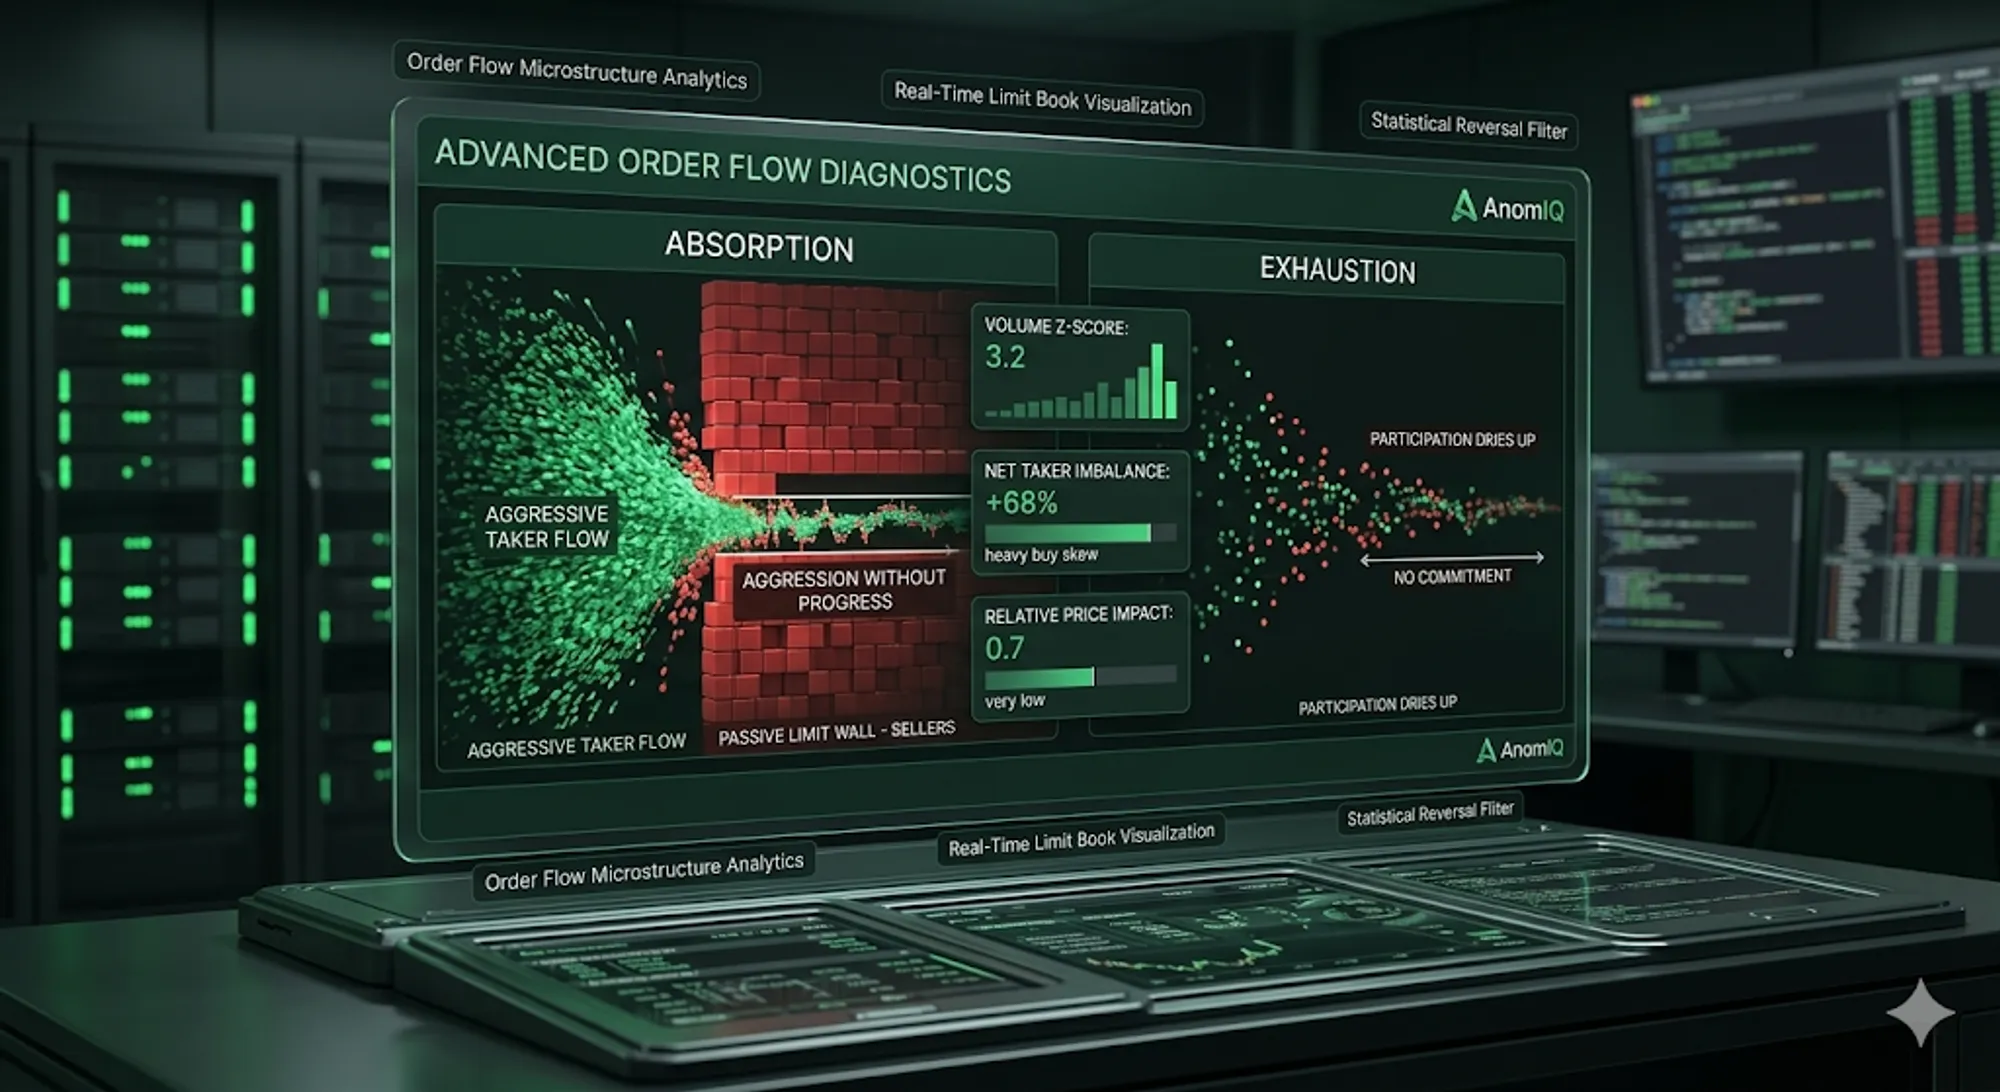
- Absorption: Aggressive market orders hit the tape in massive sizes, but the price barely advances because a dense wall of passive limit orders is taking the other side of every trade. The aggressive flow is being “absorbed” by larger structural positioning.
- Exhaustion: Aggressive participation simply dries up. As the price reaches the extreme of a move, the volume fades. There is no massive limit wall; the active participants have just exhausted their capital or interest.
Both scenarios lead to reversals or failed breakouts, but Absorption produces a more measurable real-time signature.
How to Quantify Absorption with Scanner Metrics
Historically, detecting absorption required traders to stare at a DOM (Depth of Market) or footprint chart, manually hunting across dozens of symbols to see where flow was getting stuffed.
A real-time order flow scanner can turn this fuzzy, visual tape-reading concept into a reproducible, mathematical scan by watching three metrics simultaneously:
To detect absorption mathematically, we look for a specific collision of three metrics:
1. Volume Z-Score (The Catalyst)
First, we need proof of high participation. A Volume Z-Score measures how statistically significant the current traded volume is relative to the historical baseline confirming this is not normal market noise.
- Scan Target:
Volume Z-Score > 3.0
2. Net Taker Imbalance (The Aggression)
Next, we need to confirm that this massive volume is heavily skewed in one direction. The Net Taker Imbalance tells us whether aggressive buyers or aggressive sellers are dominating the tape.
- Scan Target:
Net Taker Imbalance > +60% (Heavy Buying)or< -60% (Heavy Selling)
3. Relative Price Impact (The Friction)
This is the final, most critical piece. If volume is massive (Z-Score > 3) and highly directional (Imbalance > 60%), price should be moving rapidly. When Relative Price Impact remains low despite both of those conditions being true, it mathematically confirms the aggressive flow is hitting a passive limit wall and going nowhere.
- Scan Target:
Relative Price Impact < 0.8
The Formula for Absorption: Massive Z-Score + Extreme Taker Imbalance + Low Price Impact = Severe Absorption
Reading the Setups in Real Time
When these three metrics collide, two distinct market conditions emerge.
Pattern A: The Buy-Side Trap (Seller Absorption)
- The Data: A massive spike in Buy Volume Z-Score with highly positive Net Taker Imbalance.
- The Price Action: The candle spread is compressed. Relative Price Impact is near-zero.
- What it means: Aggressive buyers are pushing hard, but a large passive seller is absorbing every order at that level. The buying pressure is not producing proportional price movement the flow is being absorbed structurally.
- What typically follows: Once the aggressive buying exhausts itself, the absence of genuine support beneath that level becomes visible. Price tends to move back through the absorption zone.
Pattern B: The Downside Wall (Buyer Absorption)
- The Data: A massive spike in Sell Volume Z-Score with heavily negative Net Taker Imbalance.
- The Price Action: Downward price progress stalls completely.
- What it means: Aggressive selling is hitting the tape, but a large passive buyer is absorbing every offer. Sellers are failing to move price lower despite significant participation.
- What typically follows: Once the aggressive selling exhausts itself, price tends to move away from the absorption zone as the pressure that was holding it there dissipates.
Reading the Deep Dive When a Notification Fires
Statistical anomaly detection tells you whether activity is unusual. Absorption logic tells you whether that unusual activity is being accepted or rejected by the market.
If you are turning this into scanner rules, start from the full crypto order flow scanner workflow and then add the absorption conditions below.
When a notification fires, it tells you something significant is happening. The Deep Dive tells you what it means and whether it is still ongoing. Three things to watch as the data streams in:
- Is the Z-Score still elevated? While Vol Z-Score remains well above baseline, the event is still active. When it collapses back toward zero, participation has dried up and the event is ending.
- Is imbalance staying near-zero or turning directional? Near-zero imbalance during extreme volume is the exhaustion or absorption signal neither side is winning. Watch for imbalance to shift meaningfully in one direction after the event ends. That shift shows which side won the standoff.
- Is price impact normalizing? When Price Impact was near-zero during the event, volume had no directional effect. As the event resolves, how Price Impact behaves alongside imbalance tells you whether the market is now moving with structural conviction.
The challenge is not finding the event. It is knowing when it is complete. The Deep Dive shows the market state minute by minute so your assessment reflects what the data is doing, not what you expect it to do.
What Comes Next
You now have the conceptual framework. You understand what absorption and exhaustion are, why they cause reversals, and which three metrics to combine to detect them mathematically.
The next step is seeing it on live data. Part 2 covers three real market events specific assets, actual metric readings, and documented price outcomes captured with the AnomIQ scanner.