Deep Dive 2.0 is Live: Visualizing Market Friction and Order Flow
Six days ago, we outlined our vision for the next phase of AnomIQ: transitioning from anomaly detection to comprehensive structural market diagnostics.
Today, that vision is live.
We have completely rebuilt the Deep Dive panel. We’ve taken raw, complex order flow math and turned it into instant, readable visual signals.
⚠️ How to Read the Charts: The Rolling Window Advantage
Before diving into the specific metrics, it is crucial to understand how AnomIQ visualizes data. Regardless of whether you select a 5M, 15M, or 60M timeframe, the charts will always display 1-minute bars.
Why? Because AnomIQ runs on continuous rolling windows. Each 1-minute bar on the chart represents the exact cumulative calculation of the preceding 5, 15, or 60 minutes at that exact minute in time. This allows you to track the precise moment a macro-regime shifts with 1-minute precision, rather than waiting for an arbitrary hourly candle to close.
Below is a breakdown of the new diagnostic terminal, matching the layout of the Deep Dive panel:
1. Tactical Timeframes
Order flow looks entirely different depending on the memory of the market. You can now seamlessly flip between timeframes to understand both the micro-events and macro-regimes:
- 5M (The Tactical View): Highly sensitive. Perfect for spotting micro-vacuums, quick liquidity grabs, and immediate order book sweeps.
- 15M (The Swing View): The perfect middle ground for intraday structural shifts.
- 60M (The Strategic View): Acts as a massive shock absorber. Uncovers “Low Liquidity Regimes” and sustained directional drift during periods where liquidity providers appear less active.
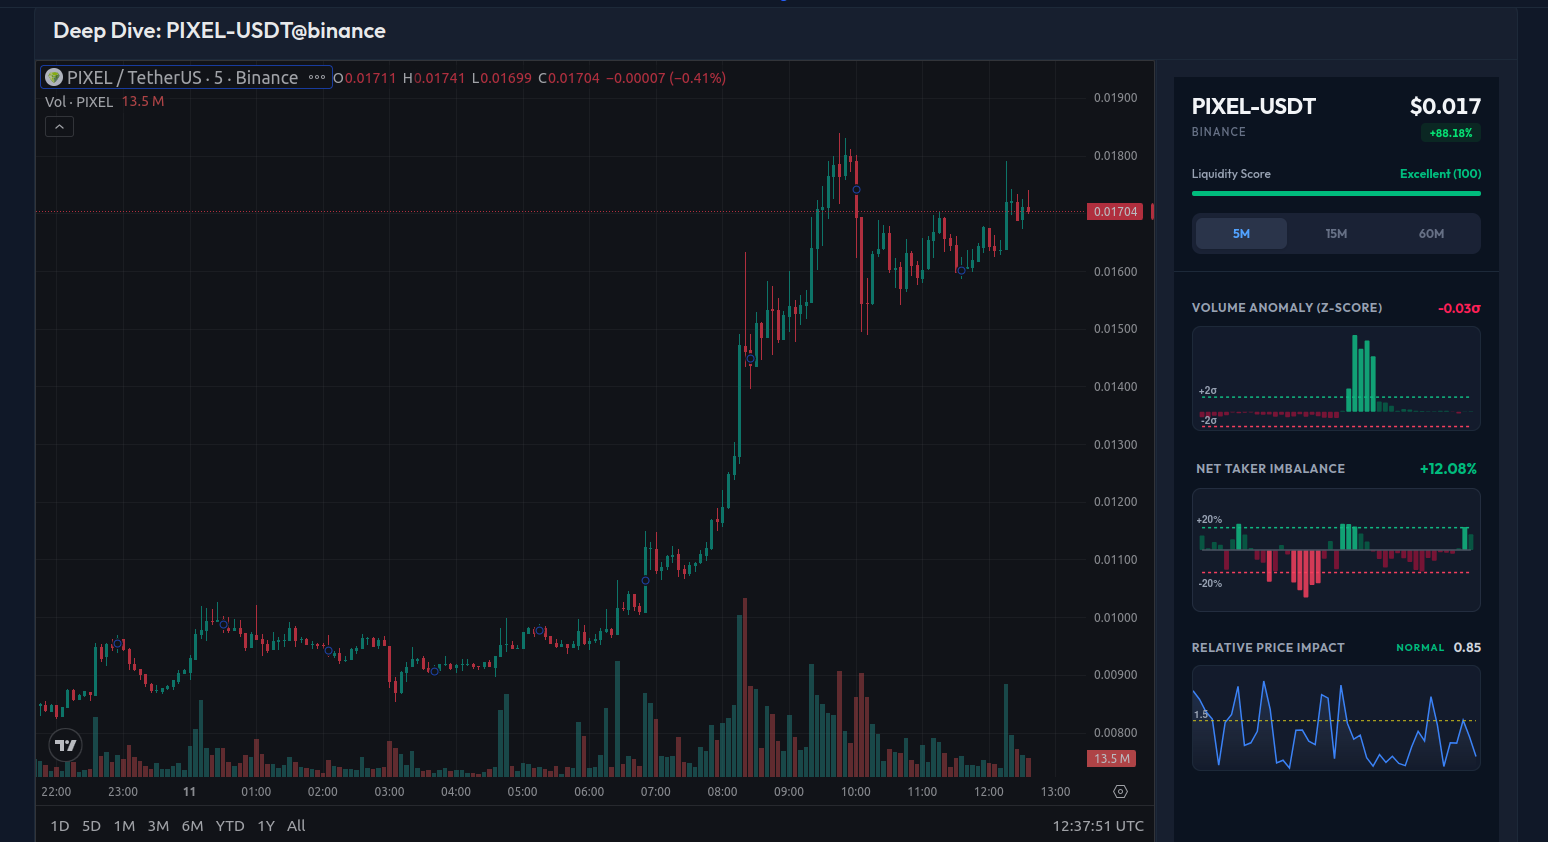
2. Volume Anomaly (Z-Score) Histograms
The Volume Anomaly chart plots exact standard deviations (Z-Scores) minute-by-minute, so you can cross-reference a breakout candle with its statistical weight.
When you see a massive breakout candle on the price chart, instantly cross-reference it here. If you see a mountain of green anomaly bars, the move is backed by heavy, relentless volume. If the histogram is flat, the move may have occurred with limited participation, and the price may struggle to sustain the move.
3. Net Taker Imbalance & Flow Bias
At the top of your Deep Dive panel, you will now see a real-time tug-of-war between Taker Bids and Taker Asks. This progress bar instantly calculates the current buy/sell volume ratio, letting you know which side is initiating trades.
To understand order flow dominance, measure the aggression of market participants. Our new Net Taker Imbalance metric measures whether the current aggressive flow is dominated by buys or sells within the active rolling window.
The math is calculated as: Net Taker Imbalance = ((Buy Volume - Sell Volume) / (Buy Volume + Sell Volume)) × 100
Yielding a clean percentage from -100% to +100%, this metric gives you a normalized read on who is dominating the tape. A positive percentage means aggressive buyers are lifting the ask; a negative percentage means sellers are driving the bid down.
Open Interest Overlay
The Net Taker Imbalance chart now includes a second signal: an indigo line showing OI Net Delta %, the percentage change in perpetual open interest over the same rolling window. A secondary scale keeps the line readable alongside the NTI bars.
Open interest is direction-neutral. Every new contract adds one long and one short. Read the line against the bars: rising OI with bullish NTI means new longs are opening; rising OI with bearish NTI means sellers are adding new shorts. When OI is flat or falling during an NTI spike, the move is running through existing positions rather than attracting new capital.
The live OI Δ% reading appears in the chart header next to the NTI value. For filter recipes and the full four-combination signal matrix, see theOpen Interest guide.
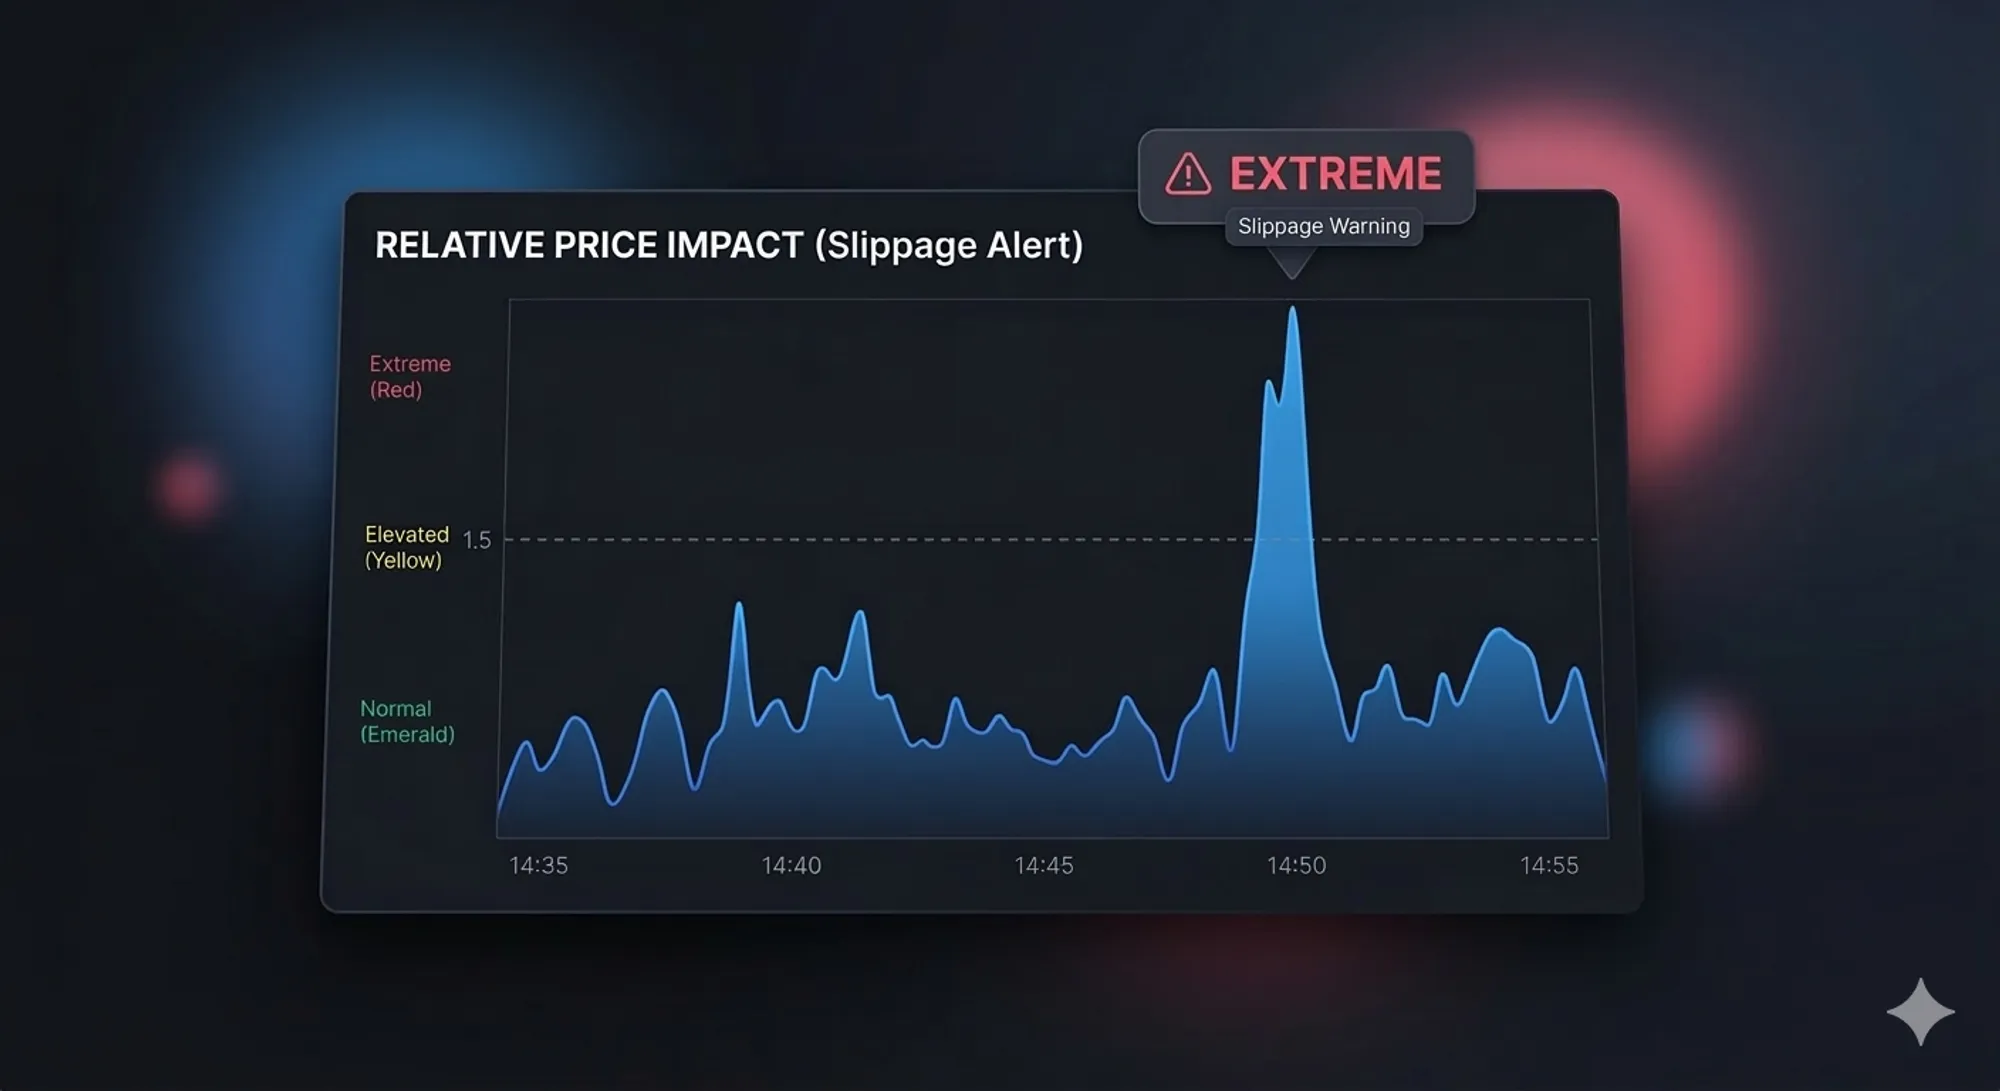
4. Relative Price Impact: The Friction Metric
A 2% move on heavy volume is structurally different from a 2% move on a thin order book.
The Relative Price Impact area chart measures market friction — price movement per unit of normal volume. The question it answers: Is this move backed by proportional participation, or is the order book thinner than usual?
We built a visual warning system directly into the chart with a dashed threshold line at 1.5:
- 🟢 NORMAL (Below the line): Price moves are backed by proportional volume. Price response is proportional to participation and absorbing flow normally.
- 🟡 ELEVATED (Crossing the line): The order book is thinning out. It is taking less volume than usual to push the price around.
- 🔴 EXTREME (Spiking sharply): Extremely thin liquidity. Price is moving aggressively relative to the amount of volume being processed, indicating elevated slippage risk.
Start Diagnosing the Market
The update is currently live for all users. Open up your dashboard, select an asset experiencing high volatility, and check the 5M Relative Price Impact to see the true physics of the move.