Net Taker Imbalance: Formula, Examples and Scanner Rules
A candle with $10 million in volume tells you how much traded. It does not tell you who was in control.
That $10 million is made up of buy-initiated trades and sell-initiated trades. They could split 50/50, a perfectly neutral event with elevated activity. Or they could split 90/10, aggressive buyers sweeping the ask. Raw volume reports the total. It cannot tell you the difference.
Net Taker Imbalance is the metric that fills that gap.
For the broader scanner workflow that combines Net Taker Imbalance with volume z-score, Relative Price Impact, liquidity gates and open interest, readCrypto Order Flow Trading: Taker Flow and Scanner Rules.
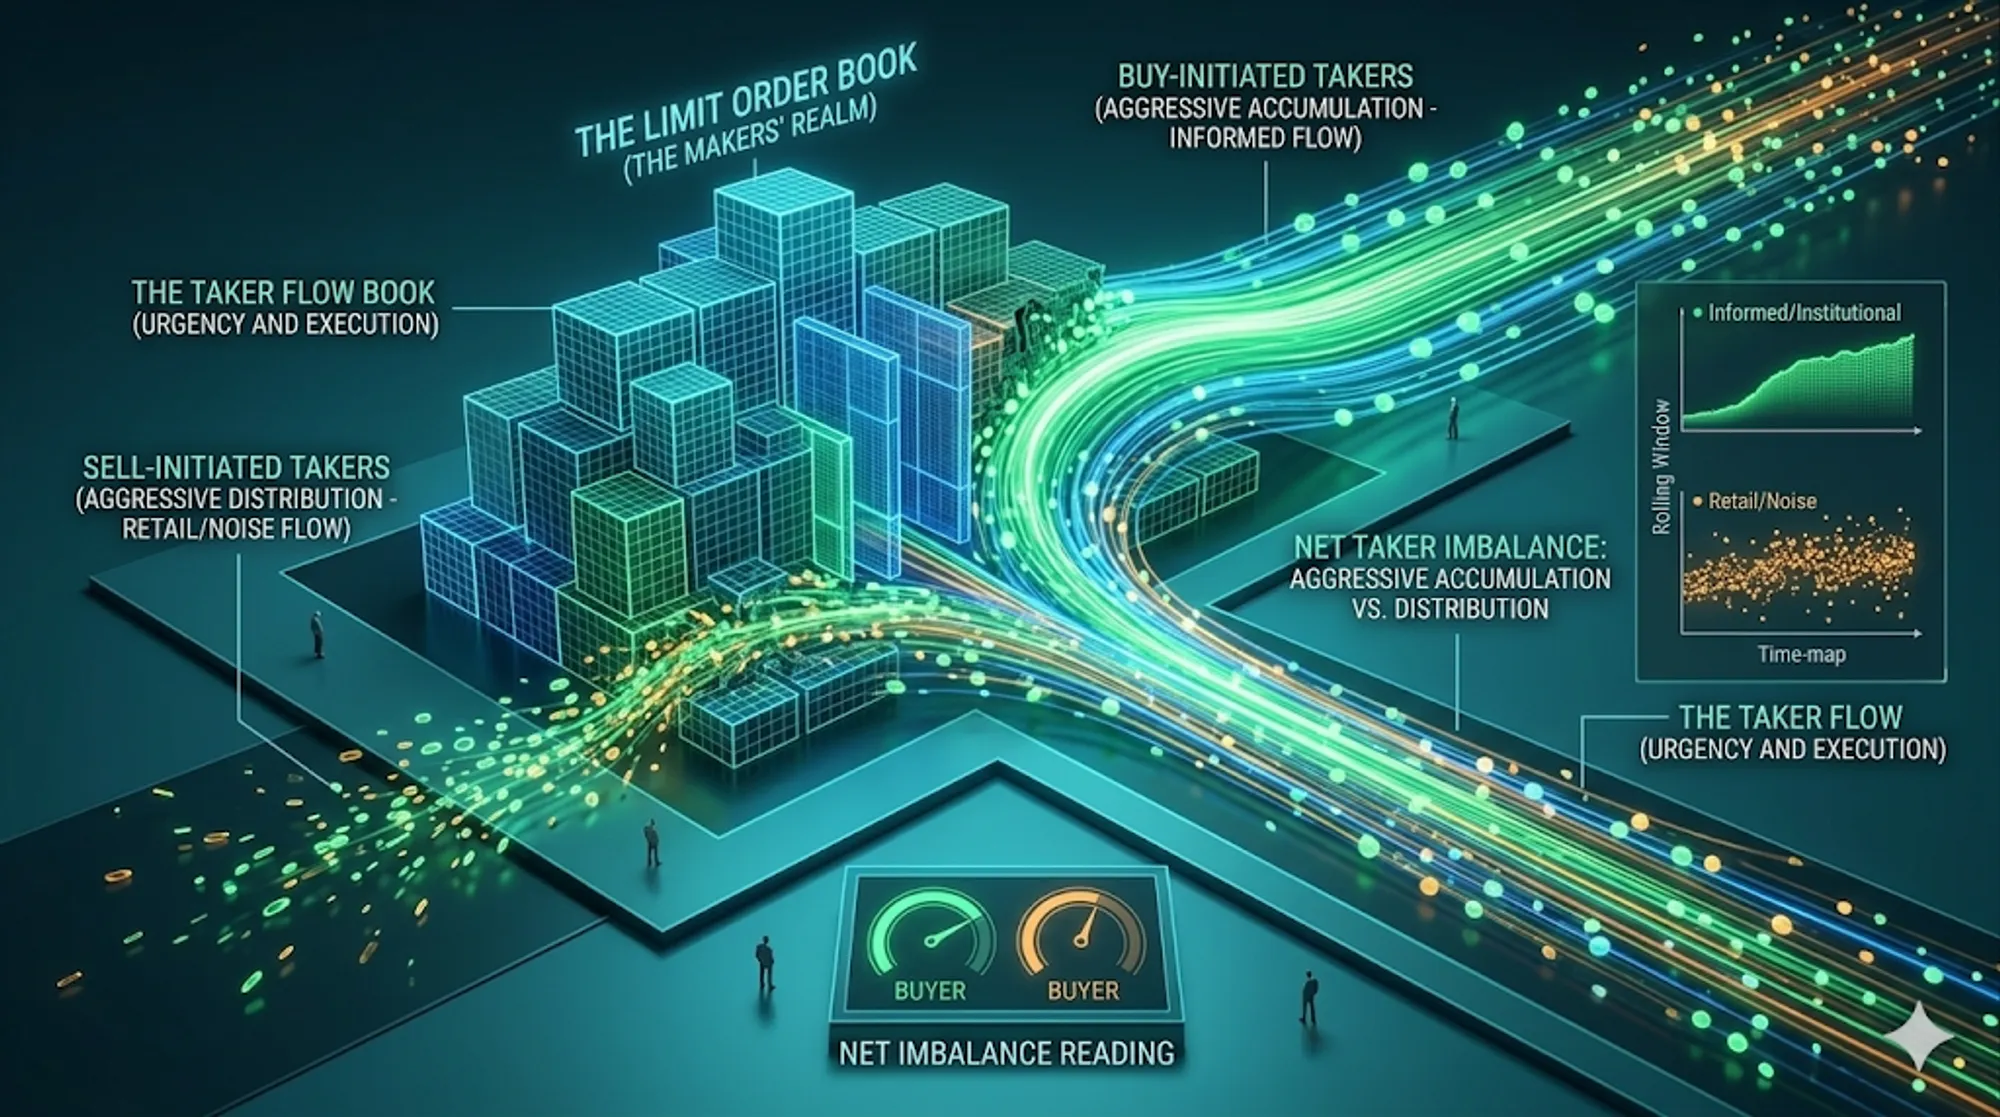
Makers and Takers
Every trade has two sides. The maker posts a limit order and waits. The taker places a market order and executes immediately against whatever is resting in the book. Takers are the aggressive side. They decided the current price was worth paying right now.
Net Taker Imbalance measures whether the aggressive flow in a given window is dominated by buyers or sellers.
The Formula
Net Taker Imbalance = ((Buy Volume − Sell Volume) / (Buy Volume + Sell Volume)) × 100The result is a percentage from −100 to +100.
- +100 every unit of volume in the window was buyer-initiated
- −100 every unit was seller-initiated
- 0 both sides are perfectly balanced
A sustained +35% means buyers have clear control of the tape. A sustained −40% means sellers do. The further from zero, the more one-sided the flow. Because the formula normalizes by total volume, the reading is directly interpretable regardless of how liquid the instrument is.
Why It Beats Raw Volume
Raw volume is symmetric by definition. Every trade requires a buyer and a seller. The exchange cannot record one without the other. A $10 million bar always contains $5 million in buy-side transactions and $5 million in sell-side transactions, because that is how a trade clears. Volume tells you the size of activity. It cannot tell you its direction.
NTI breaks that symmetry. It isolates who was willing to pay the spread to get filled immediately. That willingness is information. A limit order sitting in the book is a conditional offer. A market order is a decision. When buyers are consistently lifting the ask rather than waiting for price to come to them, that is urgency you can measure. Raw volume buries it.
The third piece is persistence. A single one-minute NTI spike to +80% that reverses in the next bar is noise. What matters is consecutive windows showing the same directional dominance. When aggressive buying holds across multiple rolling windows, the order book is being absorbed from one side. Price adjusts. You see the imbalance in the data before the candle closes.
A high-volume candle tells you something happened. NTI tells you who was driving it.
Reading the Numbers
The Deep Dive panel displays NTI as a live bar chart against the rolling window.
| Reading | What it typically means |
|---|---|
| 0 to ±15 | Balanced flow neither side has control |
| ±15 to ±30 | One side establishing dominance |
| ±30 to ±50 | Clear directional pressure |
| Above ±50 | One-sided surge often a liquidity event |
The STBL perpetual example from the absorption/exhaustion case studies shows what flat Net Taker Imbalance during extreme volume actually looks like. Four consecutive minutes: Total Volume Z-Score above 16, Net Taker Imbalance readings of +11.2%, -3.9%, +16.2%, +0.6%. Neither side gained control. That neutral imbalance during a 24σ volume event was the signal. Two-sided climactic exhaustion, not accumulation.
The Scanning Problem
Because NTI is a percentage, the scale is consistent across instruments. But the expected baseline is not.
Some perpetual contracts structurally run at +10% to +15% NTI during normal conditions. When funding rates create a persistent long bias, buy-side flow is slightly elevated even when nothing unusual is happening. A reading of +25% on that instrument is not an anomaly. It is just that asset’s floor.
A fixed threshold applied across hundreds of symbols fires constantly on structurally biased instruments and stays silent on instruments where +25% is actually an extreme reading. You cannot tune your way out of that with a single number.
The fix is the Taker Imbalance Z-Score.
Taker Imbalance Z-Score = (current NTI − historical mean NTI) / historical stddev NTIInstead of measuring the raw percentage, it measures how far the current NTI deviates from that instrument’s own history. A perpetual that normally runs at +12% NTI treats +30% as ordinary unless +30% is several standard deviations above its own norm. An instrument that normally runs at +2% NTI fires correctly at +18% if that is anomalous for it.
The same threshold works across BTC spot, a low-cap altcoin, and a structurally biased perp. No manual calibration per symbol. This is how z-score normalization extends to directional flow, not just volume. The volume-side version of the same principle is covered in Z-Score Volume Anomaly Detection in Trading.
Using Both
Raw NTI and the Taker Imbalance Z-Score are not redundant. They answer different questions.
NTI gives you the current directional balance in absolute terms. Useful for reading what is happening right now in the Deep Dive.
Taker Imbalance Z-Score tells you whether that balance is unusual for this specific instrument. That is what you need for scanner alerts across a full market.
For the broader order-flow framework behind these alerts, see Crypto Order Flow Trading: Taker Flow and Scanner Rules. For the full multi-metric anomaly framework (volume notional, trade size, trade count, and timeframe confirmation), see How to Detect Crypto Volume Anomalies in Real Time (Binance USDT + Coinbase USD).
Run them together for cross-symbol filter rules:
Taker Imbalance Z-Score (5m) > 2.5 AND Net Taker Imbalance (5m) > 15The z-score catches the statistical anomaly. The raw NTI confirms the direction and magnitude. Neither alone is enough for high-confidence scanning.
Both metrics are live in the AnomIQ scanner. Set a threshold once, the scanner watches every active pair and fires when the imbalance is anomalous for that specific instrument.