
Does Crypto Pairs Trading Work? I Backtested 137 Cointegrated Pairs

Trader turned software engineer, with 4+ years building systems for crypto exchanges. Founder of AnomIQ, a real-time crypto anomaly scanner for quantitative traders.
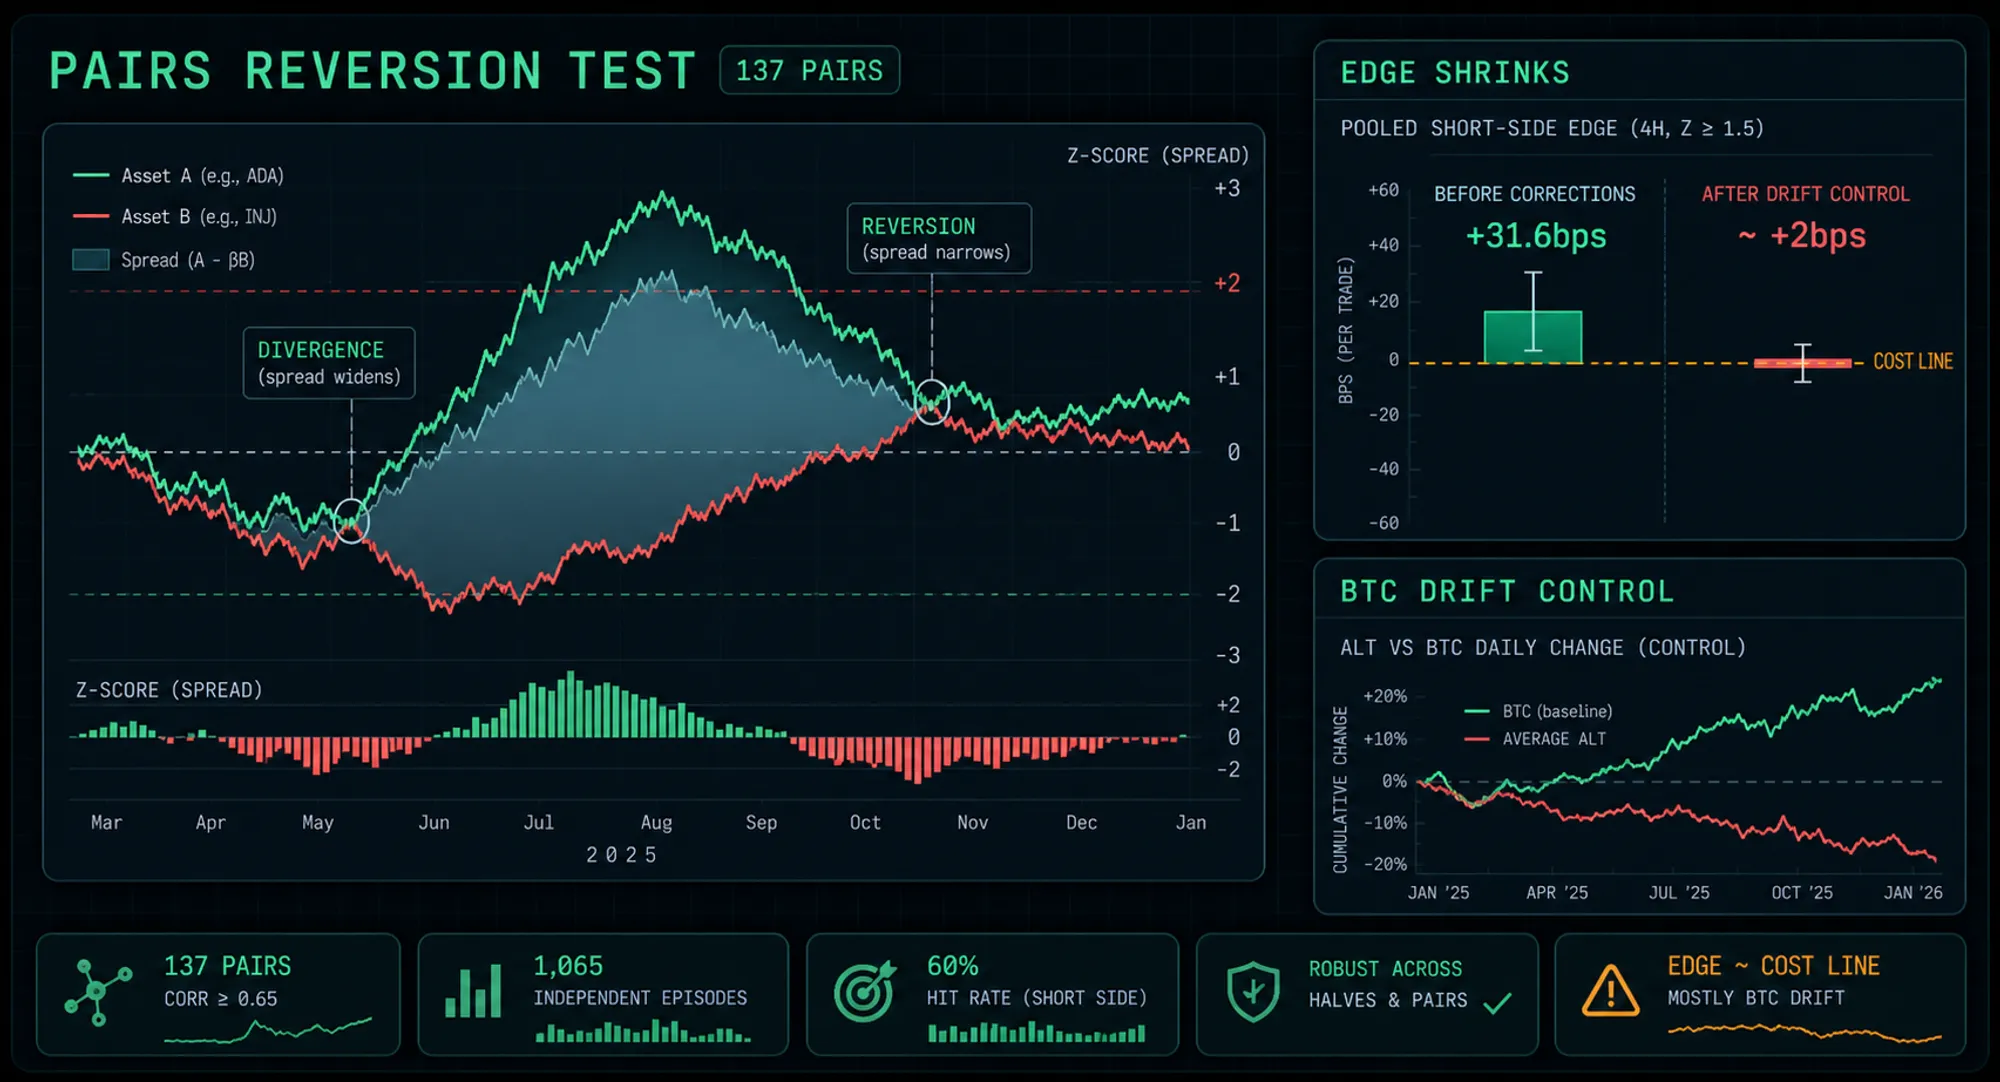
Crypto pairs trading did not produce a tradeable edge in my backtest. Across 137 cointegrated crypto pairs and a full year of 2025 data, the spread between correlated coins showed a real short-side tendency to revert, but it did not clear two-leg transaction costs, and most of it traced back to alts drifting lower against Bitcoin all year.
AnomIQ’s simulator replays a full year of tick-level trade data per symbol through the same pipeline that runs the live scanner. I can point a market’s worth of history at a trading idea instead of eyeballing a chart and guessing. The last time I did that,single-asset mean reversion did not survive the test. One follow-up question I could not leave alone: if a coin does not return to its own average, does the spread between two coins return to theirs?
This was the closest I have come to a real reversion edge in this research program, and it still did not clear the bar. The reason it failed teaches more than a clean no would. The edge passed every robustness check I ran at the time, a later audit of my own result found two more inflators, and most of what was left was market drift that lined up with a short bet.
Key Takeaways
- A naive single-pair scan (ADA/INJ) overstated its sample 14-18x: daily recalibration turned one multi-day divergence into many “independent” trades.
- Pooled across 137 pairs, a short-side spread reversion effect is real before costs, with 92 of 137 pairs positive and both halves of 2025 clearing zero.
- A re-audit found a midnight recalibration artifact and one crash night (October 10-11, 2025) carrying a third of the return. Corrected, the best combination is about +20bps over four hours, below the 16-20bps cost of a two-leg trade.
- An unconditional control showed alts underperformed Bitcoin by about 24-31bps per day on average in 2025, which explains why only the short side looked profitable.
Why Pairs Trading Is a Different Bet
A pairs trade makes a market-neutral bet: instead of betting one coin returns to its own average, it bets the spread between two correlated coins returns to theirs, cancelling out the shared market move that drives any single coin’s price. It is a long-standing form of statistical arbitrage, studied on US equities in the classic Gatev, Goetzmann, and Rouwenhorst paper.
That distinction is the whole reason to test it. Every single-asset reversion hypothesis I had already rejected bet on one symbol snapping back to its own reference, which leaves the trade fully exposed to where the market goes next. A cointegrated pair hedges that out. If ADA and INJ usually move together and their spread stretches unusually wide, you can sell the rich leg, buy the cheap one, and profit from the spread closing, whether the whole market rises or falls in the meantime. Published crypto research on dynamic cointegration pairs trading has reported it beating buy-and-hold after microstructure costs, which is more than any single-asset reversion result in the literature can say. It was the cheaper of the two mean-reversion families I had not tested, and it needed no new data. So I tested it.
Turning Cointegration Into a Pairs Trading Rule
The rule was a standard cointegration spread trade: for every sufficiently correlated pair, fit a hedge ratio, confirm the pair is cointegrated, z-score the resulting spread, and enter when that z-score stretches past a threshold, betting on a snap back toward zero.
I screened all usable symbols in the 50-symbol 2025 dataset for correlation and kept the 137 pairs above 0.65, a range that ran from 0.65 up to 0.81 for the tightest pair. Each pair got a daily-recalibrated hedge ratio from an ordinary least-squares fit on a trailing 30-day window, gated by an Engle-Granger cointegration test on that same window, then frozen and applied out-of-sample to the next day’s spread. I measured forward returns on the spread itself, not either leg’s own price, at 15, 30, 60, and 240-minute horizons, with entry thresholds at z-scores of 1.5, 2.0, and 2.5.
The First “Edge” Was an Artifact
The single best-looking pair, ADA against INJ, produced a dramatic result in a naive scan, and it was an artifact of counting the same episode dozens of times.
The naive read looked like a strategy: about +22 to +41bps per trade on several hundred events. But the daily recalibration produced a subtler overlapping-sample problem than the single-asset test had. Because the spread’s z-score gets recalibrated once per calendar day, a single divergence that lasts several days produces a fresh “first bar of the day” on each of those days, even though they are all samples from one continuing episode rather than independent trades. Collapsing those into independent episodes, defined as runs separated by real gaps, gutted the sample:
| Entry threshold | “Non-overlapping” events | True independent episodes | Inflation |
|---|---|---|---|
| z ≥ 1.5 (long side) | 422 | 24 | 17.6× |
| z ≥ 2.5 (long side) | 117 | 8 | 14.6× |
With a true count of 8 to 24 events, every cell of ADA/INJ’s forward-return check came back too thin to assess, with confidence intervals spanning hundreds of basis points in both directions and sign flips at the 15-minute horizon. None of the single-pair result was real. This is the same overlapping-sample bias that sank my single-asset backtest, with one new wrinkle: the overlap crossed the daily recalibration boundary, which the “first bar of a run” dedup I had used elsewhere missed. Slow-moving, periodically-recalibrated references are more prone to this bias than continuously-adapting ones, not less.
Pooling 137 Cointegrated Pairs: The Result That Almost Held
Pooling independent episodes across all 137 pairs to recover statistical power, a genuine short-side reversion effect survives: when the spread is unusually rich, it reverts more often than not, with a confidence interval that excludes zero and holds across both halves of the year.
No single pair has enough independent episodes to trust on its own, so I pooled per-episode forward returns across every pair, grouped by threshold, side, and horizon. This is the same logic I used to recover power in the cross-sectional checks elsewhere in this research. The short side held up:
| Entry z | Horizon | Episodes | Pairs | Gross mean | 95% CI | Hit rate |
|---|---|---|---|---|---|---|
| 1.5 | 30 min | 1,066 | 137 | +14.53bps | [3.78, 25.29] | 57.0% |
| 1.5 | 60 min | 1,066 | 137 | +21.06bps | [9.38, 32.75] | 60.3% |
| 1.5 | 4 hr | 1,065 | 137 | +31.56bps | [18.00, 45.13] | 60.8% |
| 2.0 | 4 hr | 752 | 136 | +37.03bps | [17.60, 56.46] | 60.6% |
| 2.5 | 4 hr | 531 | 130 | +39.10bps | [12.06, 66.14] | 60.3% |
Then it passed the checks that had exposed every earlier artifact as noise. Taking the best-powered combination, an entry at z ≥ 1.5 held for four hours across 1,065 episodes:
| Robustness check | Result |
|---|---|
| Pair concentration | Top 10 pairs = 15.6% of episodes |
| Date concentration | 285 unique dates; top 10 dates = 14.0% |
| Sign consistency | 92 of 137 pairs (67%) positive; sign test z ≈ 4.0 (p < 0.0001) |
| First half of 2025 alone | +19.68bps, CI [4.22, 35.14], clears zero |
| Second half of 2025 alone | +41.50bps, CI [20.23, 62.76], clears zero |
This was more solid than any single-asset reversion hypothesis I had tested, and I had tested twelve of them. Both halves of the year cleared zero independently, in the same direction, and two-thirds of the pairs agreed. Nothing rode on one lucky pair, and by episode count no handful of dates dominated. If the story ended here, I would be writing about a real edge. It does not end here: counting episodes turned out to hide a single crash night, covered in the re-audit below.
Why “Almost” Doesn’t Count: The Cost Line and a Warning Sign
The gross effect is real, but a pairs trade pays transaction costs on two legs instead of one, and after that doubled cost the edge, as first measured, only clears zero at the four-hour horizon, under the more optimistic fee assumption, with a margin of a couple of basis points at best.
Earlier single-asset threads used a ~10bps round-trip cost as a conservative stand-in, with real Binance perpetual taker fees closer to 4-5bps a side. Two legs doubles the floor to about 16-20bps round-trip. Subtract that from the gross:
| Entry z | Side | Horizon | Gross | Net @ 16bps | Net @ 20bps |
|---|---|---|---|---|---|
| 1.5 | short | 4 hr | +31.56bps | CI [+2.00, +29.13] | CI [−2.00, +25.13] |
| 2.0 | short | 4 hr | +37.03bps | CI [+1.60, +40.46] | CI [−2.40, +36.46] |
| 2.5 | long | 4 hr | +34.28bps | CI [+0.48, +36.08] | CI [−3.52, +32.08] |
| 30 / 60-min combos | N/A | N/A | N/A | crosses zero | crosses zero |
Only the four-hour hold clears zero, and only under the 16bps assumption, by a hair. At the more conservative 20bps, every combination’s net confidence interval includes zero. That is cost-breakeven, not cost-clearing, and the re-audit further down pushed it below the line. The single-asset thread reached a similar verdict, one rung lower down the ladder.
There was also something a clean reversion mechanism should not do. A textbook cointegrated spread should revert symmetrically: an unusually rich spread should fall about as often as an unusually cheap one rises. This one did not. The short side, betting a stretched-rich spread falls, cleared zero across almost every threshold and horizon. The long side, betting a stretched-cheap spread rises, was much weaker, with only one combination clearing zero. When one direction of a supposedly symmetric bet works and the other does not, the honest question is whether you have found reversion or a one-directional drift that happens to line up with your short side.
Chasing the Asymmetry: Alts Against Bitcoin Directly
To find out whether that asymmetry was reversion or drift, I ran a cleaner sibling test: 38 alts measured against Bitcoin instead of against arbitrary partners, gated by the live Correlation to BTC (24h) field and a rolling spread z-score with no daily freeze. That is the same field behind the BTC correlation scanner. Of the 38, 33 produced enough qualifying episodes to pool.
The first pass produced a result too good to be true: 95 to 100% hit rates and 80 to 140bps at every threshold and horizon. That uniformity was the tell. No real signal in this research program had behaved like that, and my best validated result, the pooled pairs effect above, topped out at a 60% hit rate. The bug was in the measurement. I read forward returns off the same 60-minute windowed spread I had picked the entry from, so once the original spike aged out of the window, the number fell toward zero whether or not price reversed. Measuring on the raw, unwindowed relative price instead made it vanish: the first symbol dropped to 43 to 60% coin-flip hit rates, with every confidence interval including zero.
With the measurement fixed, the short horizons did not clear costs at any threshold. The 24-hour horizon looked promising until I broke it down by side:
| Correlation gate | Entry z | Side | n | Gross mean | 95% CI | Symbols agreeing |
|---|---|---|---|---|---|---|
| ≥ 0.5 | 2.0 | short | 2,482 | +42.29bps | [25.38, 59.20] | 29 / 33 (88%) |
| ≥ 0.5 | 2.5 | short | 2,391 | +50.23bps | [32.42, 68.04] | 29 / 33 (88%) |
| ≥ 0.5 | 2.0 | long | 2,342 | −23.75bps | [−40.36, −7.15] | 7 / 33 (21%) |
| ≥ 0.5 | 2.5 | long | 2,103 | −24.30bps | [−42.84, −5.76] | 10 / 33 (30%) |
The short side clears costs. The long side at the same horizon is a near mirror-image negative that agrees across only a fifth to a third of symbols, the same asymmetry from the pairs test but sharper. And it fails the one check the pairs result had passed. Splitting the best short combination by half-year is decisive: the first half of 2025 is +82.33bps, confidence interval [56.38, 108.28], enormous; the second half is +7.77bps, [−14.23, 29.77], which does not clear zero. One half of the year carries the entire effect. The pairs result had passed this same test, both halves clearing zero on their own. This one fails it.
The Control That Closed It: It Was Mostly Drift
A control with no trading signal, just the plain day-over-day change in each alt’s price relative to Bitcoin, showed alts underperformed Bitcoin on average through most of the year. That is the same pattern the “edge” had been tracking.
No entry signal, no correlation gate. Just one question: on an average day in 2025, how did an average alt do against Bitcoin? With no signal to warm up, this control covers all 39 alt symbols in the dataset, including one with too little history for the signal test.
| Period | Average alt-vs-BTC daily change | Symbols negative |
|---|---|---|
| First half of 2025 | −31.0bps/day | 30 / 39 |
| Second half of 2025 | −24.0bps/day | 25 / 39 |
Once I measured that, the asymmetry made sense. The short side of every spread test, betting the alt underperforms, was riding this drift and looked profitable. The long side, betting the alt catches up, was fighting it and lost. The signal and gate amplified the magnitude a little, so a small real reversion effect may ride on top of the drift, but the market regime drives the headline “clears costs” result, not a clean per-pair reversion mechanism.
It also answers the open question the pairs test left behind. That test’s short-side-only edge looked like it might be this same confound, but I could not prove it from the pairs alone. Measured against Bitcoin, the drift is unambiguous. The pairs result’s true cost margin, net of it, is most likely worse than the already-marginal headline number, not better. The cleanest mean-reversion result in this project is mostly a market-regime artifact. It is also why genuine coin-specific decoupling from Bitcoin has to be read against what the rest of the alt market did that day, not against zero.
The Re-Audit: Two More Inflators in the Pairs Result
Two days after this post first went live, I re-audited the pooled pairs result from its raw episodes and found two problems the original checks missed. Corrected for both, no combination clears two-leg costs, even under the optimistic 16bps assumption.
I rebuilt all 19,799 pooled episode returns from the raw data, matching every recorded value to within 0.5bps, then split the episodes by properties the first pass never looked at.
The midnight refit. The hedge ratio is re-fit every midnight on a trailing window that includes the divergence day itself. The refit absorbs part of the divergence into the new parameters, so the measured spread shrinks toward zero across midnight even if neither price moves. A real position keeps the hedge ratio it entered with. Measured that way, the artifact was +12 to +44bps of phantom reversion per episode that crossed midnight, larger at higher z, and exactly zero for episodes that closed within the day. About 13% of four-hour episodes crossed midnight.
One crash night. The date check above counted episodes. Weighted by return instead, it inverts: October 10-11, 2025 held 1.1% of the episodes but 33.6% of the pooled short-side return, and the top five dates held 46.4%.
| z ≥ 1.5, short, 4 hr | Gross mean | 95% CI | Net @ 16bps |
|---|---|---|---|
| As first measured | +31.56bps | [18.00, 45.13] | CI [+2.00, +29.13] |
| Entry hedge ratio held fixed | +29.99bps | [16.07, 43.91] | CI [+0.07, +27.91] |
| Fixed hedge ratio, excluding October 10-11 | +20.13bps | [10.88, 29.38] | CI [−5.12, +13.38] |
That was the best combination; every other one came out worse. The corrected numbers also have the wrong shape. On the clean within-day returns, the short-side effect weakens as the entry gets more extreme: +21.79, +16.99, and +7.51bps at z of 1.5, 2.0, and 2.5. A real reversion mechanism should strengthen, or at least hold, as the stretch grows. The rising pattern in the first pooled table came from the two inflators, both of which grow with z.
Some of it held. Clustering the confidence intervals by date and by week widened them 20 to 50%, and most short-side combinations still exclude zero before costs (z ≥ 2.5 no longer does). Dropping any single symbol leaves the effect intact, and both halves of 2025 still clear zero on their own: +18.23bps, CI [2.75, 33.70], in the first half and +39.83bps, CI [17.81, 61.85], in the second. A small gross short-side reversion tendency, about +20bps over four hours, is real. It sits below the cost of a two-leg trade, not on it.
The Verdict on Crypto Pairs Trading
Crypto pairs trading, the market-neutral version of mean reversion, held up longer than the single-asset version, but it still does not clear the bar: the gross spread edge is real, the net edge does not survive two-leg costs once the measurement is corrected, and the part that looked tradeable is largely a market-wide alt-versus-Bitcoin drift rather than a repeatable reversion mechanism.
Two things could still change that. A two-leg round trip of roughly 6-8bps, which in practice means maker execution on both legs, would put the corrected ~20bps gross effect above costs. And a version of the test that subtracts the same-day cross-sectional alt-versus-Bitcoin move from each episode before pooling would isolate whatever clean reversion effect survives once the drift is removed. I did not build it here, because the uncontrolled result already fails the stability check.
One limitation applies to every number above: this is a price-only backtest. Entries and exits use the recorded trade price, with a flat round-trip cost subtracted as a stand-in for fees and slippage combined. There is no order-book depth model and no per-exchange fee schedule, and a two-leg trade doubles whatever real slippage would apply.
None of that erases what the thread produced. Four new failure modes are now permanent guardrails:
- Overlapping samples can hide across a recalibration boundary, not just within a run.
- A forward outcome is never measured on the same window used to pick the entry.
- A recalibrated signal’s outcome is measured with the entry-time parameters frozen, the position you would actually hold.
- Concentration checks are weighted by return, not just counted, and every result gets a dose-response check across entry thresholds.
The pairs and correlation code is reusable, and it points at the one mean-reversion family I have not tested yet: funding-rate basis reversion, which needs data the platform does not collect. The market-neutral version turned out hollow too, on top of the single-asset version. That rules out another whole family of mean-reversion strategies, which is worth knowing before risking money on one.
The next research step widened the question again: which event-time features actually predict large crypto moves once direction, volatility, price impact, volume profile location, and BTC linkage are tested together.
The Correlation to BTC field this test leaned on runs live in AnomIQ’s scanner, updating in real time across the market, the same input pointed at the present instead of a backtest. The free BTC correlation table for Binance perps shows the current 1H and 24H readings. If you want the historical data to run a test like this one yourself, email support@anomiq.io and I’ll see what I can pull.
Related Reading
- What Predicts a Big Crypto Move? 16,726 Extreme-Volume Events Tested
- I Had a Year of Tick Data on 8 Symbols. Mean Reversion Still Didn’t Survive It.
- I Thought I Found a Short Squeeze Pattern. Then I Tested 39 Symbols.
- Relative vs Absolute Signals: Why Fixed Thresholds Fail Crypto Scanners
FAQ
Does pairs trading work for crypto mean reversion?
In this test, not tradeably. Across 137 cointegrated crypto pairs and a full year of 1-minute data, the spread between correlated pairs did show a real, statistically significant tendency to revert on the short side. But once measurement artifacts and one crash night were removed, that gross edge was about +20bps over four hours, below the 16-20bps cost of trading two legs, and a control showed much of it was a market-wide alt-versus-Bitcoin drift rather than a clean cointegration effect.
What is cointegration in pairs trading?
Cointegration is when two prices that each wander on their own nonetheless stay tethered, so a specific combination of them, the spread, stays statistically stable. Pairs trading bets that when that spread stretches unusually wide, it snaps back, regardless of where either individual price goes next.
Why did a statistically significant backtest result still get rejected?
Three reasons. The gross edge was real, but once corrected it sat below the two-leg transaction-cost line, not on it. It weakened as entries got more extreme, the wrong shape for a reversion mechanism. And a plain control with no trading signal showed alts underperformed Bitcoin on average through most of 2025, which means the profitable short side was largely riding that market-wide drift rather than a repeatable reversion mechanism.
How is pairs mean reversion different from single-asset mean reversion?
Single-asset reversion bets one coin snaps back to its own recent average, which keeps it fully exposed to the market’s direction. Pairs reversion trades the spread between two correlated coins, which cancels out the shared market move and isolates the relative mispricing. That makes it a different bet, and the reason it was worth testing after single-asset reversion had failed.