Relative vs Absolute Signals: Why Fixed Thresholds Fail Crypto Scanners
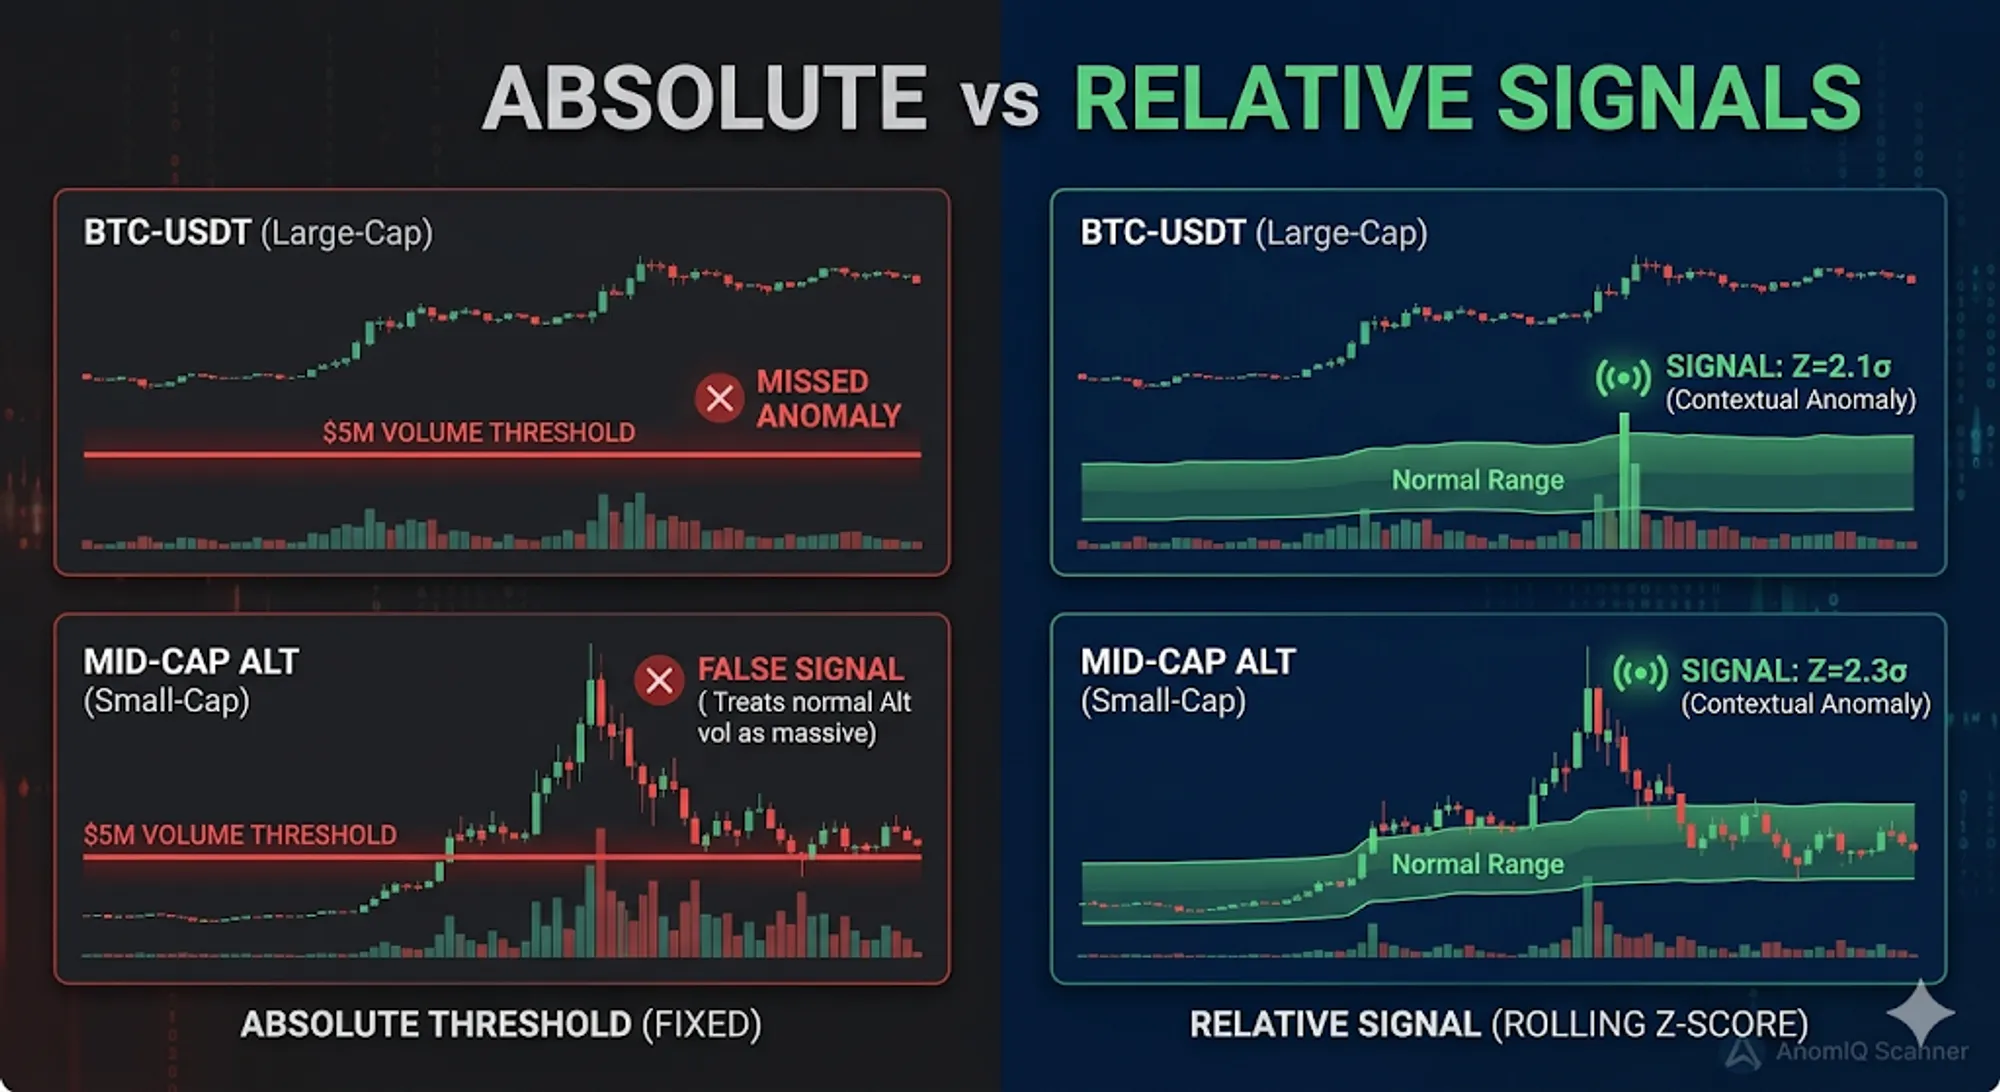
A scanner fires at $5M volume. On BTCUSDT at 14:00 UTC, that is a quiet minute. On a mid-cap altcoin at 03:00 UTC, it is the most active minute the asset has seen all week. Same threshold, opposite situation. Fixed cutoffs measure absolute size and have no mechanism to distinguish the two.
What a Fixed Threshold Measures
A fixed threshold checks whether the current value exceeds a preset number. It cannot tell whether that number is unusual for this asset at this time.
Volume varies by liquidity, market cap, time of day, and volatility regime. $10M on ETH-USDT is unremarkable during a London session. On a mid-cap altcoin at the same hour, it signals something structural in the order book. A scanner with a single cutoff treats both identically.
Price moves have the same problem. A 2% candle on a liquid perpetual contract is noise. On an asset with thin order books and 40% daily volatility, it may already be halfway through its move.
What a Relative Signal Measures
A relative signal measures whether the current reading is statistically unusual for this specific asset right now.
The mechanism is arolling z-score:
z = (current_value - rolling_mean) / rolling_stddevThe rolling mean and standard deviation come from the asset’s own recent activity, not a global benchmark. A z-score of 2.0 means the current reading sits two standard deviations above that asset’s own baseline. The threshold applies identically to BTCUSDT and to a token with 0.1% of Bitcoin’s liquidity. Both are measured against their own baselines, so the reading means the same thing on either: statistically unusual for this instrument right now.
For the volume-specific version of this workflow, including buy volume z-score, sell volume z-score, and concentration metrics, see Z-Score Volume Anomaly Detection in Trading.
Each asset supplies its own reference point. The threshold self-calibrates without any manual input.
Why This Matters Across Market Caps
Absolute thresholds require separate calibration for each market cap range. Set the cutoff high enough for BTC and it never fires on a small-cap. Set it low enough for the small-cap and it fires on BTC through quiet sessions. There is no single number that works for both.
A 2σ deviation on BTC and a 2σ deviation on a small-cap are equally anomalous for their respective instruments. The z-score normalizes against each asset’s own baseline. The filter needs no knowledge of market cap, session volume, or volatility regime.
One preset, one threshold, covers the full market. A filter set to flag volume z-score above 2.0 applies to all tracked assets regardless of size.
Why Fixed Thresholds Go Stale
A threshold set in January may be meaningless by March. When a market shifts from low to high volatility, what triggered an alert last month reads as normal once the asset’s baseline volume has grown. Absolute thresholds need manual recalibration each time conditions change.
Rolling z-scores update continuously as new data arrives. When volume increases across a regime, the mean and standard deviation rise with it, so crossing 2.0σ requires more absolute volume than before. No manual adjustment needed.
What This Looks Like With Real Numbers
Two assets caught by the same scanner filter at the same moment, 15-minute volume z-score above 2.0:
| Asset | Daily Volume | 15m Vol vs Baseline | 15m Vol Z-Score |
|---|---|---|---|
| XPL-USDT | $7.7M | 3.2x | 3.58 |
| NEWT-USDT | $372K | 2.2x | 2.51 |
XPL trades twenty times more notional volume per day than NEWT. In absolute terms they are not comparable. The z-scores are, because each is calculated against that asset’s own rolling baseline. Both read above 2.0. Both are flagged.
A fixed threshold calibrated to catch an XPL event sits far above NEWT’s entire daily volume. Set it low enough to catch NEWT and it fires on XPL through normal sessions. The z-score above 2.0 handles both without adjustment.
AnomIQ runs relative signals across all tracked markets. Volume, taker imbalance, and price impact are each z-scored against the asset’s own rolling window across three timeframes, identifying what is statistically unusual for that instrument.
The same preset flags anomalies on BTC, ETH, and assets with a fraction of their daily volume. The signal is always relative to that instrument’s own history. Order flow absorption uses the same logic to identify when large participants are active. Get started with the scanner to build your first filter.