
Bitcoin Volume Profile Levels Explained: POC, VWAP, VAH, VAL, HVN and LVN

Trader turned software engineer, with 4+ years building systems for crypto exchanges. Founder of AnomIQ, a real-time crypto anomaly scanner for quantitative traders.
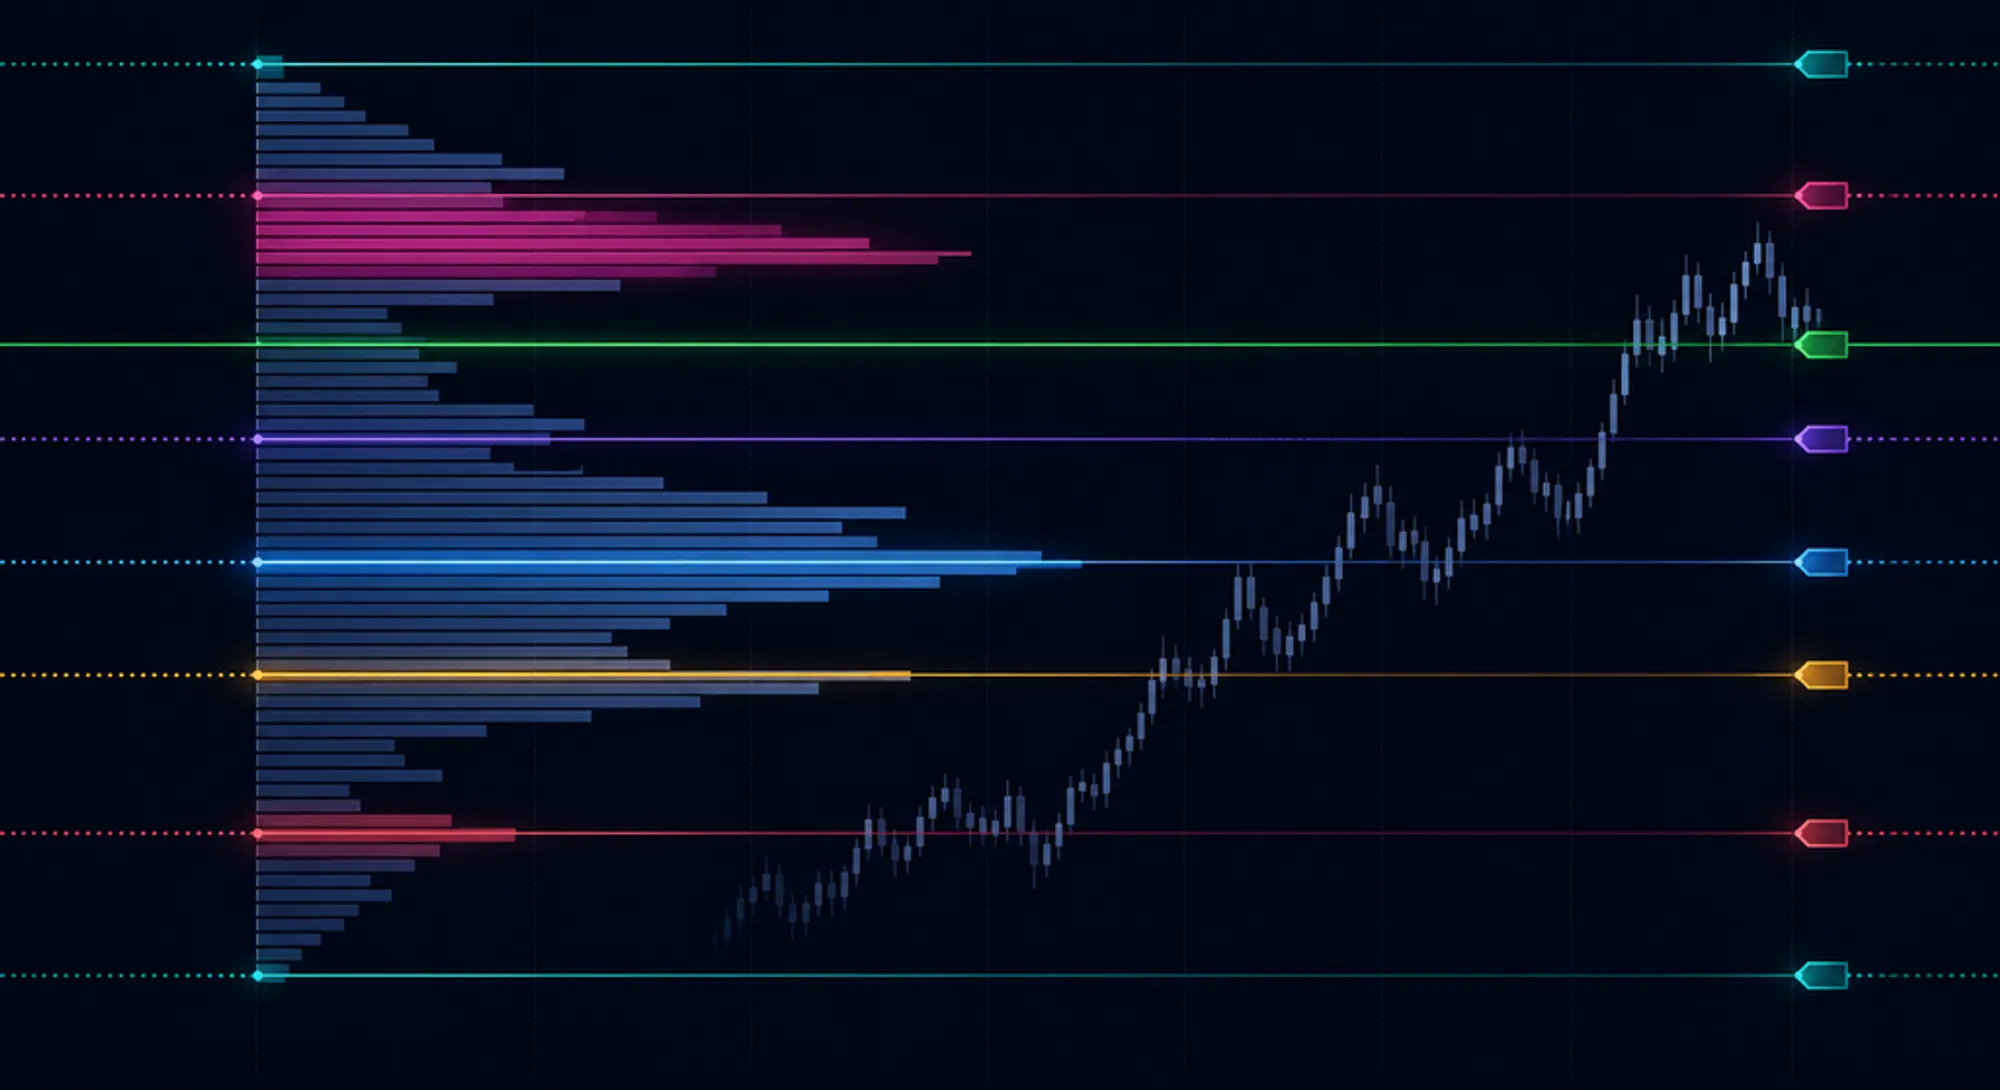
A Volume Profile can make a simple question look harder than it is: where did people actually trade?
Thelive Bitcoin Volume Profile answers that with volume bars on the left and eight numbers on the right. The right-hand panel is the useful part when you want an exact price instead of another shape on a chart.
There is one catch. The panel mixes live values with levels from yesterday. Read them all as support and resistance and you have already asked the data to say more than it knows.
Bitcoin Volume Profile levels at a glance
| Raw Values row | What it shows | Does it move today? |
|---|---|---|
| Current Price | Latest BTCUSDT market price | Yes |
| Developing POC | Busiest price bucket in the active UTC session | Yes |
| Session VWAP | Volume-weighted average since 00:00 UTC | Yes |
| Previous Day POC | Busiest bucket from the completed UTC session | No |
| Previous VAH | Upper edge of yesterday’s Value Area | No |
| Previous VAL | Lower edge of yesterday’s Value Area | No |
| Nearest HVN | Closest high-volume range from yesterday | The ranges are fixed; the nearest one can switch |
| Nearest LVN | Closest low-volume range from yesterday | The ranges are fixed; the nearest one can switch |
Sky blue and violet belong to today’s developing session. Amber, green, fuchsia and rose mark yesterday’s finished profile. The colors are labels, not a confidence score.
How signed distance works
The sign describes where current price sits. It is not the percentage change of the level itself.
For a single price level, the calculation is:
signed distance (%) = (current price - reference price) / current price × 100Below the reference is negative. Above it is positive. Current Price is the ruler, so its own row always reads 0.00%.
Nodes need one extra rule because an HVN or LVN is a range, not one price. The tool measures to the nearest edge and returns zero when BTC trades inside the range.
Take the example that tends to cause confusion: BTC at $62,870.00 and an HVN from $63,350.00 to $63,749.90. BTC is below the node, so the nearest edge is $63,350.00.
(62,870 - 63,350) / 62,870 × 100 = -0.76%The midpoint does not enter the calculation. Neither does the far edge.
Current Price
Current Price is not a Volume Profile level. It is the ruler used to measure every other row.
The value comes from the live BTCUSDT Binance perpetual market feed. On the chart, the emerald dashed line lets you see the same price against the volume bars instead of hunting for it on the axis.
Use the Current Price row in the live BTC panel as your starting point.
Developing POC
Developing POC answers one question: which price bucket has traded the most volume today? The panel prints that bucket’s midpoint as a single price.
“Today” means the active UTC session. “Developing” means the answer can change. If another bucket collects more volume before the session closes, the sky-blue POC moves with it.
That makes Developing POC useful for reading the session as it forms. It also makes the timestamp matter. The value you see at 08:00 UTC is not guaranteed to survive until 20:00 UTC.
Watch BTC’s Developing POC live, or read the deeper Point of Control scanner guide for the bucket calculation. The underlying Market Profile methodology, devised by J. Peter Steidlmayer at the Chicago Board of Trade, predates crypto by decades.
Session VWAP
VWAP compresses every trade since 00:00 UTC into one volume-weighted average price. Large trades carry more weight than small ones. The result keeps moving until the session ends.
POC and VWAP are easy to lump together because both use price and volume. They do different jobs:
POC  = the busiest price bucket
VWAP = the volume-weighted average price
One is the mode of the volume distribution. The other is its weighted mean. Seeing them apart is not an error; it tells you that the session’s busiest price and average traded price are different.
Compare current BTC with the live Session VWAP. The Price vs Session VWAP metric carries the same relationship into scanner filters.
Previous Day POC
At the end of the UTC session, the profile stops developing. Its busiest bucket becomes the Previous Day POC used during the next session.
This is yesterday’s fixed reference, marked in amber. It will not drift while you are watching it. Only current price moves closer, farther away, or through it.
That fixed-versus-live distinction is the whole difference between Previous Day POC and Developing POC. One is finished. One is still being written.
Open BTC’s Previous Day POC or see how its distance becomes a scanner condition in Previous Day POC Distance.
Previous VAH
VAH means Value Area High. It is the upper edge of the previous session’s main trading range around POC.
This row is often misread. BTC can be inside yesterday’s Value Area and still show a negative distance to VAH. That simply means price is below the upper edge. Check VAL before deciding whether price is inside or outside value.
The current boundary is in the Previous VAH row.
Previous VAL
VAL means Value Area Low, the lower edge of that same range. It comes from the same completed profile as VAH and stays fixed for the session.
Read both boundaries together:
- above VAH: price is above yesterday’s Value Area
- between VAL and VAH: price is inside it
- below VAL: price is below it
Check BTC’s Previous VAL. If you want one scanner field for the entire range, use Previous Day Value Area Distance.
Nearest HVN
An HVN is a bulge in the profile: a price area where relatively heavy volume traded during the previous session. It is a band, not a perfectly precise line. That is why the panel prints two prices.
“Nearest” means the shortest route from current price to the edge of any previous-day HVN. It does not mean nearest midpoint. BTC can also move far enough that a different fixed HVN becomes the closest one.
See the range selected as BTC’s Nearest HVN. For market-wide filtering, the equivalent field is Nearest Previous Day HVN Distance.
Nearest LVN
An LVN is the thinner part of the profile, where less volume traded relative to the surrounding price areas. Like an HVN, it can span several adjacent buckets.
The distance logic is unchanged: nearest edge, zero inside the range. What changes is the profile shape. HVN marks concentration; LVN marks a pocket with less prior-session volume.
The live tool shows BTC’s Nearest LVN, while Nearest Previous Day LVN Distance exposes it to the scanner.
Read the panel in two passes
First, read the active session. Current Price against Developing POC and Session VWAP tells you where BTC trades relative to today’s busiest bucket and weighted average.
Then bring in yesterday. Previous Day POC gives you one fixed concentration point. VAH and VAL tell you whether price is inside or outside the previous Value Area. HVN and LVN show the local thick and thin parts of that completed distribution.
Suppose BTC is above Session VWAP and Developing POC but still below Previous VAH. The plain reading is enough: price is above today’s volume references and has not reached yesterday’s upper value boundary. Calling that setup bullish adds an interpretation. The profile itself only gave you location.
That separation matters in a scanner. Volume Profile answers where. Volume spikes, taker imbalance, open interest and price action answer what is happening there. The previous-day Volume Profile scanner guide shows how those two layers fit together across many markets.
What these levels cannot tell you
A POC is not automatically a magnet. An HVN is not guaranteed support or resistance. An LVN is not an express lane that price must cross quickly. VAH and VAL do not turn every touch into a breakout or rejection.
All of those stories can be reasonable hypotheses. None comes from Volume Profile alone. The profile records where volume traded. Direction still needs live evidence.
When AnomIQ tested the POC-as-magnet idea across 40 symbols, the apparent edge disappeared once overlapping samples were counted once. The volume profile in crypto guide walks through that test.
Common questions
Why can Developing POC move while Previous Day POC stays fixed?
They belong to different sessions. Developing POC is today’s unfinished leader. Previous Day POC is yesterday’s final one.
Why can VAH be negative while BTC is inside the Value Area?
Because the VAH row measures one boundary. Price inside value still sits below its upper edge, which produces a negative number. VAL tells you where price sits relative to the lower edge.
Why does an HVN or LVN show two prices?
Nodes cover ranges. Showing both edges avoids pretending the profile identified one exact price. Distance is measured to the nearest edge and reads zero inside the node.
How often does the live page update?
Every 30 seconds. Current Price, Developing POC and Session VWAP can change. Previous-session POC, VAH, VAL, HVNs and LVNs stay fixed until the daily reference rolls forward.
Open the live Bitcoin Volume Profile and start with location. Demand separate evidence for direction.
To track these distances across every market instead of BTC alone, open the AnomIQ scanner.