
Volume Profile in Crypto: POC, Value Area, HVN and LVN

Trader turned software engineer, with 4+ years building systems for crypto exchanges. Founder of AnomIQ, a real-time crypto anomaly scanner for quantitative traders.
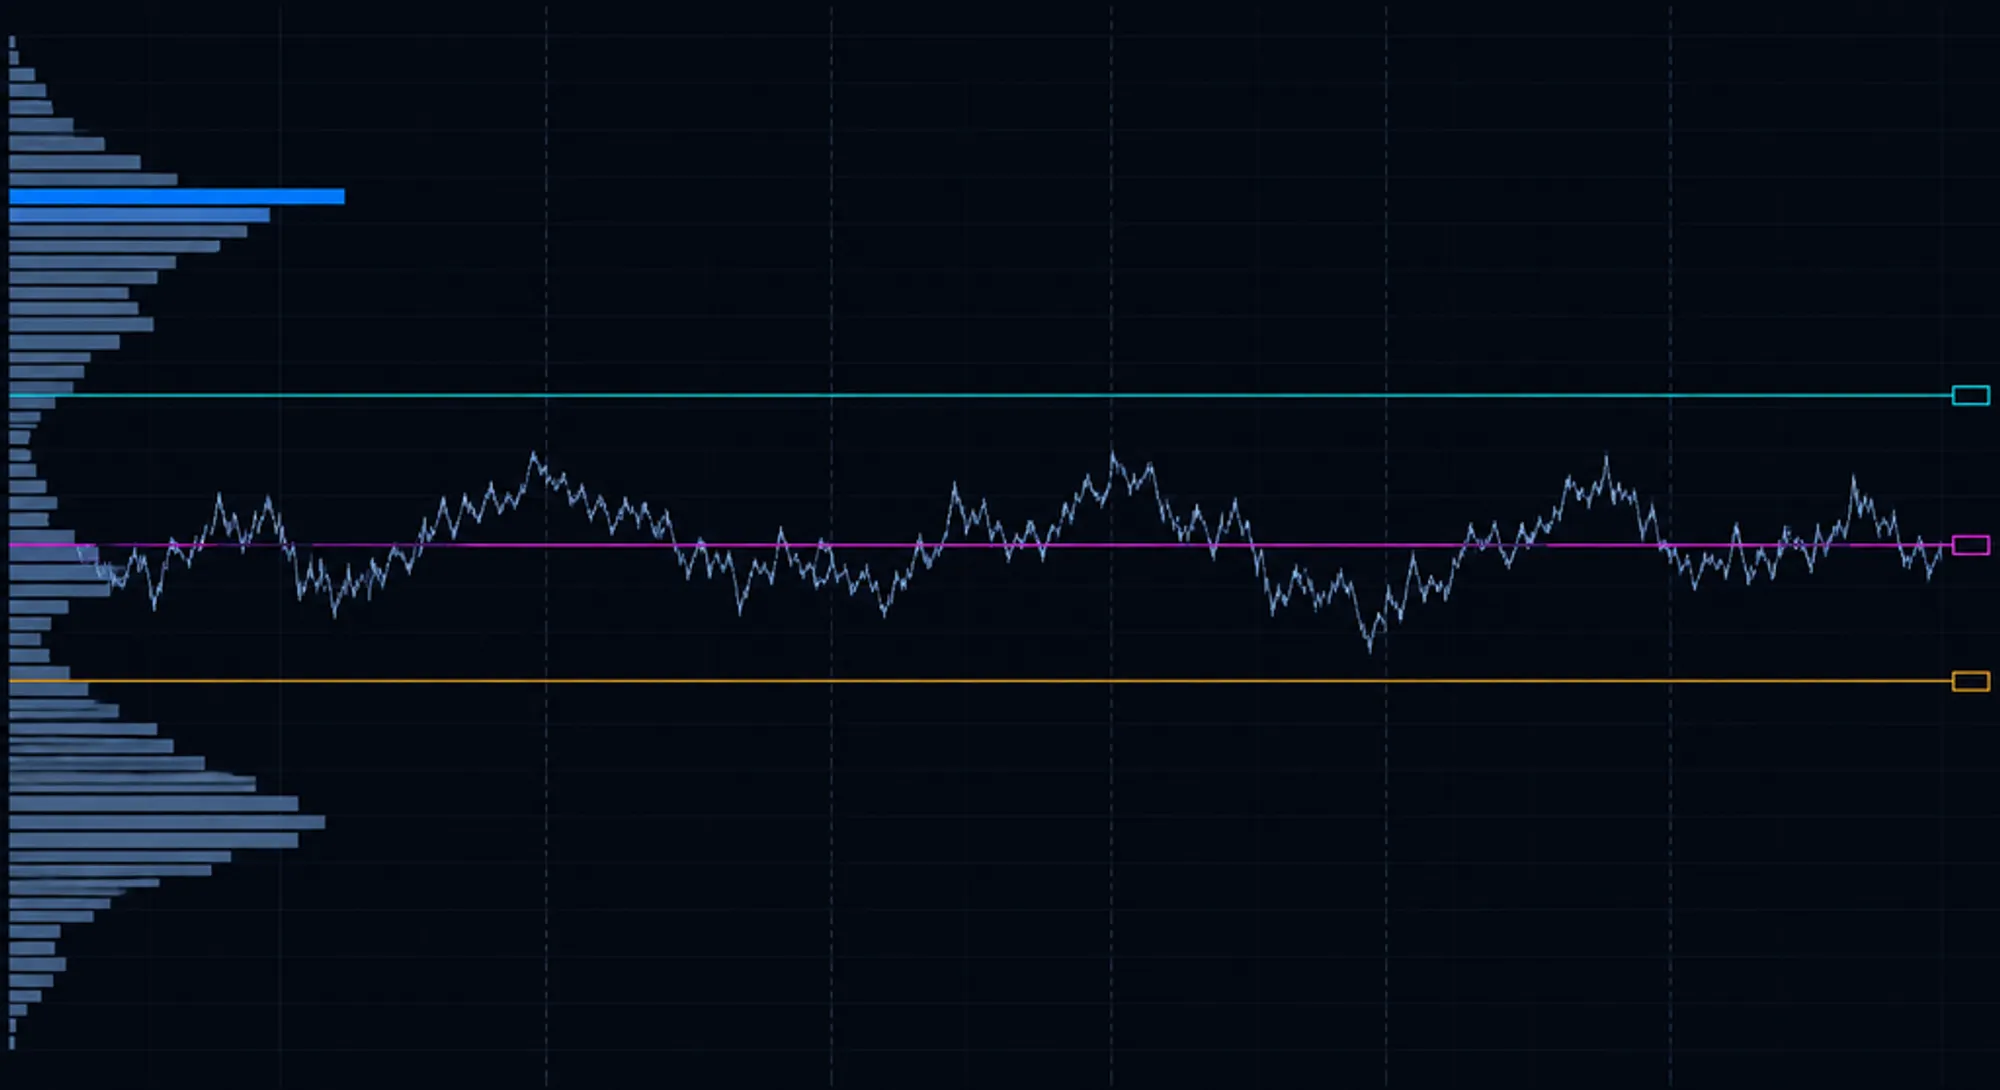
A volume profile in crypto is a horizontal histogram of traded volume by price over a chosen window. It marks the Point of Control (POC), the price band with the most volume; the value area, the range that held about 70% of it; and the high and low volume nodes that show where price was accepted or passed through quickly.
Most volume profile guides are written for futures and equities, where the session opens and closes at fixed times. Crypto never closes. That single difference changes two settings every guide takes for granted: what counts as a session, and how wide each price row should be.
If you already use one on TradingView, you know the shapes. This guide covers the mechanics behind each level, the two crypto-specific adjustments, and what happened when we tested the most popular strategy against 40 symbols of our own data.
Key Takeaways
- The POC is the single price bucket with the most traded volume. The value area is the contiguous range around it holding 70% of volume, with VAH and VAL as its edges.
- High volume nodes are runs of price where volume stayed heavy (acceptance). Low volume nodes are thin pockets between heavier areas, where price moved through quickly.
- Crypto has no session close, so the profile window is a choice. AnomIQ uses the completed UTC day, which stays fixed for the whole next day.
- One row size cannot fit every coin. On September 30, 2026, a range-divided-by-24 rule gave BTC $100 rows and ETH $3 rows on Binance perpetuals.
- When AnomIQ tested “price reverts to yesterday’s POC” across 40 symbols, a raw edge of +17.84 bps at 1 hour disappeared once each episode was counted once instead of 43 to 47 times.
What is a volume profile?
A volume profile plots how much volume traded at each price over a set window, as horizontal bars beside the chart. A candlestick chart answers “how much traded in this period?” A volume profile answers “how much traded at this price?” The busiest price is the Point of Control, and the thick and thin areas around it show where the market spent its effort.
The idea comes fromMarket Profile, developed by J. Peter Steidlmayer at the Chicago Board of Trade. It predates crypto by decades, and it was built for markets with a clear open and close.
Volume profile vs Market Profile
Market Profile counts time: each period in which price touched a level adds a mark at that level. Volume profile counts traded volume at each level. The two often agree, but they diverge when price spends a long time at a level on light activity, or passes quickly through a level on heavy activity.
Crypto exchanges publish every trade, so volume at each price is directly observable rather than approximated through time.
Want to see the levels before reading further? The live Bitcoin volume profile tool shows BTC’s developing POC, previous-day POC, value area, HVN and LVN on one page.
How to read a volume profile: POC, value area, VAH and VAL
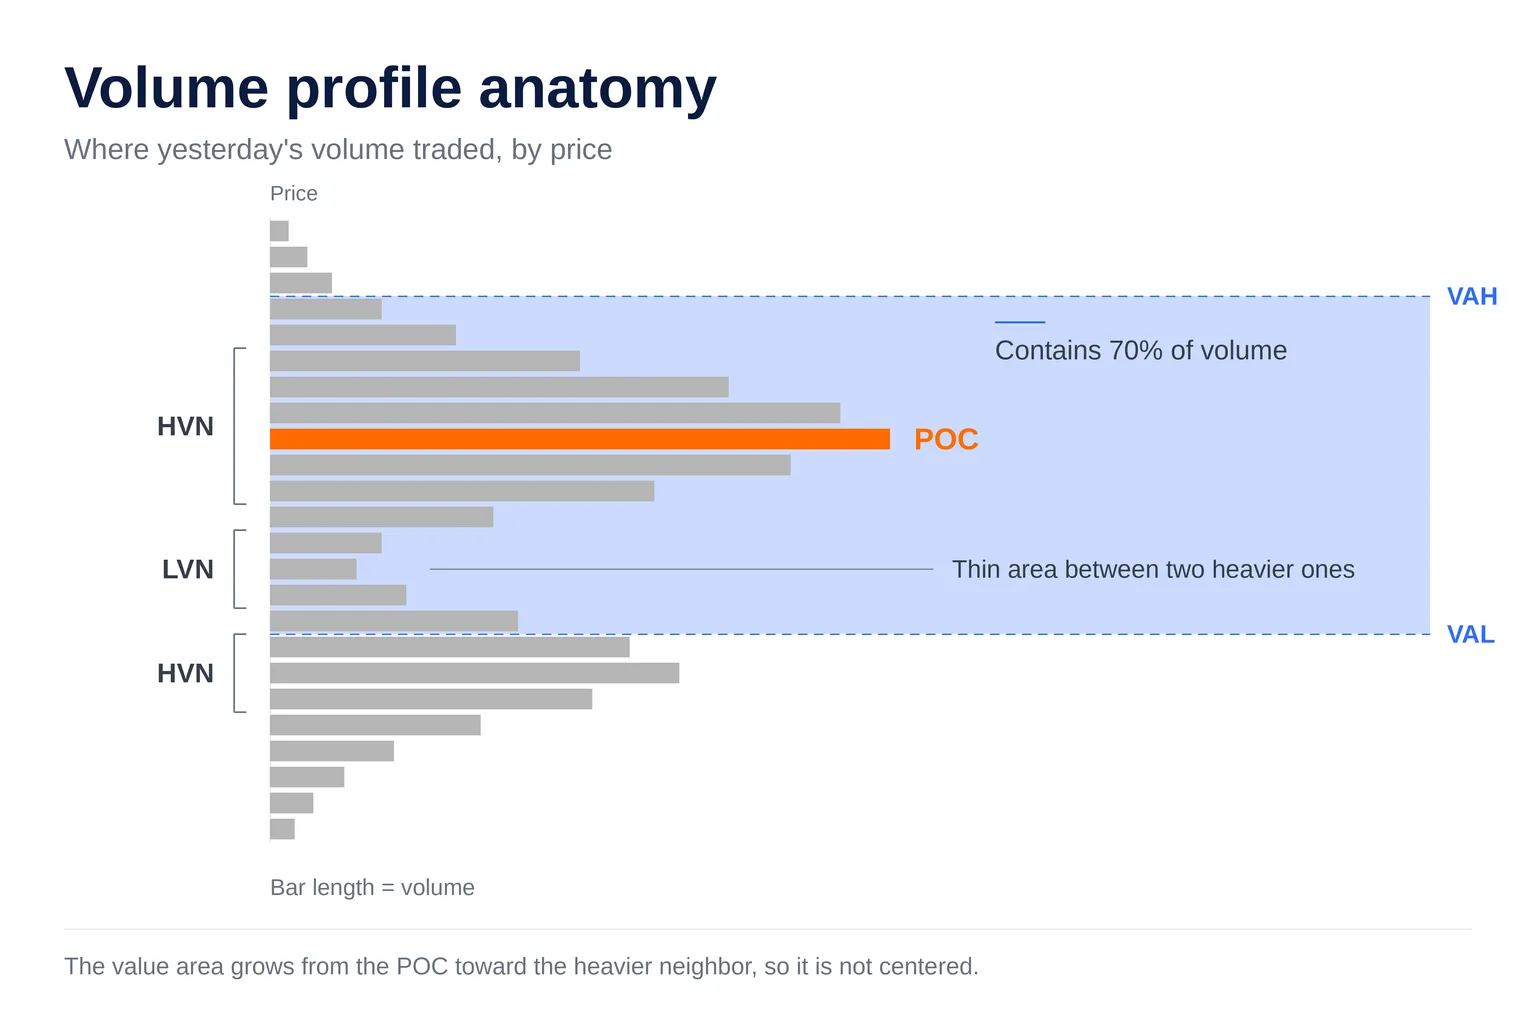
Read the profile from the inside out: find the POC, then the value area around it, then the edges.
Point of Control
The Point of Control is the price bucket with the most traded volume in the window. It is a band, not a single price. Its width is whatever row size the profile uses, which matters more in crypto than most guides admit (covered below).
The POC is where the most two-sided business happened. That makes it a reference level, not a prediction. For how a POC turns into a scanner condition across many coins, see the Point of Control scanner guide.
Value area and the 70% convention
The value area is the range around the POC that contains a set share of the window’s volume, conventionally 70%. TradingView’s volume profile documentation uses 70% as the default and notes it is the trader’s choice. The usual rationale is that roughly 68% of a normal distribution sits within one standard deviation of the mean.
The construction is mechanical. Start at the POC bucket. Compare the next bucket above with the next bucket below, add whichever traded more, and repeat until the running total reaches 70% of the window’s volume. In AnomIQ’s implementation, that expansion happens one bucket at a time.
Because of that construction, the value area is not centered on the POC. If volume above the POC is heavier, the value area extends further up.
VAH and VAL
Value Area High (VAH) and Value Area Low (VAL) are the edges of that range. Inside them, the previous window’s market found two-sided agreement on price. Outside them, price is trading somewhere that window treated as less acceptable.
That is a description of location, not of what comes next. AnomIQ measures it with Previous Day Value Area Distance (%): signed distance to the nearest edge, and 0 anywhere inside.
High volume nodes vs low volume nodes
A high volume node (HVN) is a run of price where volume stayed heavy. A low volume node (LVN) is a thin pocket between heavier areas. The common reading is acceptance versus rejection: the market did a lot of business inside an HVN, and moved through an LVN without stopping to trade.
Most guides stop at “thick” and “thin.” Exact definitions make the levels testable, so here are the rules AnomIQ uses on the completed UTC-day profile:
| Level | Rule | Max kept |
|---|---|---|
| HVN | Consecutive buckets, each with at least 50% of the POC bucket’s volume | 5, ranked by total volume |
| LVN | A bucket with at most 35% of the POC bucket’s volume, with a bucket of at least 50% of POC volume somewhere above it and somewhere below it | 5, ranked by lowest volume |
The two-sided condition on LVNs matters. A thin bucket at the very top of the day’s range is just the edge of the auction, not a gap between two areas of acceptance. Requiring heavy volume on both sides filters those out.
How price behaves at these levels on the next day is an open question per coin. Price often slows inside an HVN and moves faster through an LVN, but “often” is a hypothesis to check, not a rule. The Nearest Previous Day HVN Distance (%) and Nearest Previous Day LVN Distance (%) metrics tell you when price is at one, so you can watch what happens.
Volume profile shapes: D, P and b
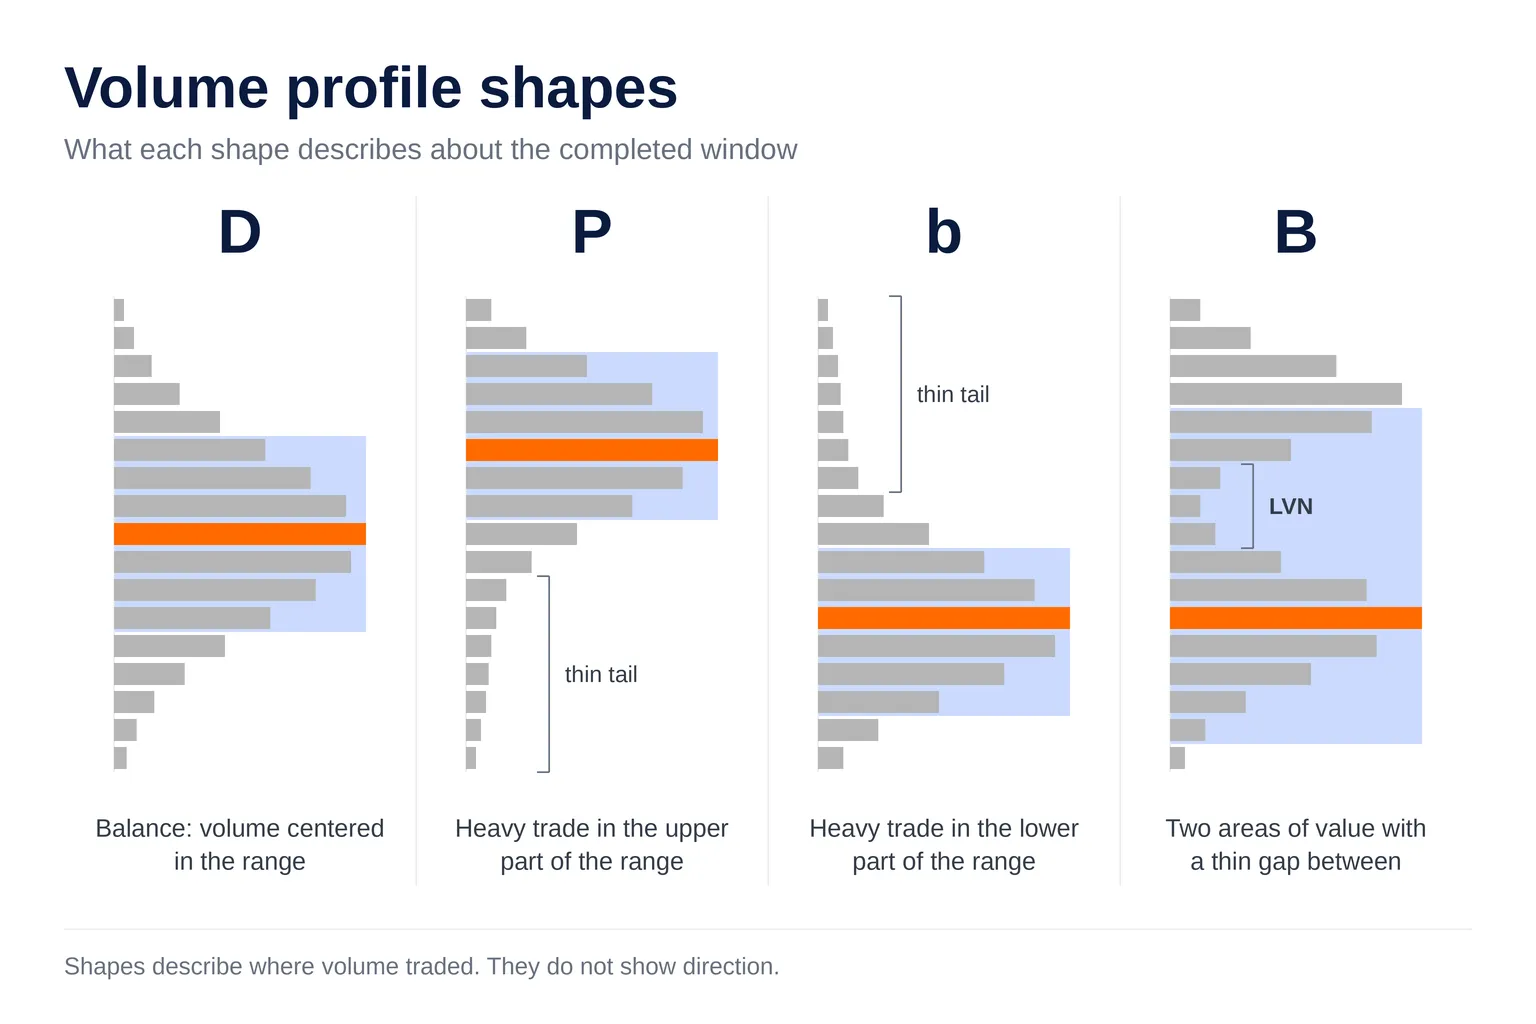
Volume profile shapes summarize where the window’s volume concentrated relative to its range. They are descriptions of a completed auction. Each has a common reading, and each has a limit.
| Shape | What it shows | Common reading | What it does not tell you |
|---|---|---|---|
| D | Volume concentrated mid-range, thinning toward both extremes | Balance: two-sided trade around a fair price | Which way the balance resolves |
| P | Heavy volume in the upper part, a thin tail below | Price moved up, then traded heavily at higher prices | Whether new buying or covering shorts produced it |
| b | Heavy volume in the lower part, a thin tail above | Price moved down, then traded heavily at lower prices | Whether new selling or closing longs produced it |
| B (double) | Two HVNs separated by an LVN | Value moved from one area to another inside the window | Which area the next window will treat as fair |
Shapes depend entirely on the window. The same 24 hours of BTC can look like a D on a UTC-day profile and a P on a profile anchored at the low of an intraday move. That is why the window choice comes first in crypto.
Volume profile in crypto: two problems futures guides skip
Futures volume profile tutorials assume two things crypto does not give you: a session boundary, and a tick grid that suits a fixed row setting. Both need an explicit decision.
No session close: choosing a profile boundary
Equity markets open and close every day, and even electronically traded futures pause daily for maintenance, which gives every profile a natural boundary. Crypto trades through weekends and holidays without a pause, so the boundary is a choice. Charting tools offer several anchors (session, fixed range, visible range), and each behaves differently on a 24/7 market:
- UTC day. Matches the 00:00 UTC daily candle used by major exchanges. Once complete, it is fixed and comparable across every coin.
- Rolling 24 hours. Never settles. The POC can shift every minute, so it is a poor reference level.
- Fixed range. Precise, but manual. You choose the anchor, so it does not scale past a few charts.
- Visible range. Changes every time you zoom or scroll. Two traders looking at the same coin can see different POCs.
Consider a trader who reads POCs off a visible-range profile on a 1-hour chart. They zoom out to check context, and the POC jumps to a level from three days earlier. Nothing in the market changed; the window did. A profile used as a reference level has to stay put.
AnomIQ uses the previous completed UTC day. Every trade from that day counts, and the resulting POC, value area and nodes stay fixed for the whole of the current day. The Bitcoin volume profile levels guide shows how that fixed previous-day profile sits next to the developing one on the live BTC panel.
Row size: why one setting cannot fit BTC and a thin altcoin
Row size, the price height of each bucket, decides how many buckets a day’s range is split into. Too wide and the profile collapses into a few bars; too narrow and the volume scatters across thousands of near-empty rows. A single fixed setting cannot work across coins whose prices differ by a factor of a million.
AnomIQ sizes each coin’s buckets from that coin’s own previous day: the day’s high-to-low range in exchange ticks, divided by 24, rounded to a 1-2-3-5-8 step, and clamped between 25 and 20,000 ticks. Here is that rule applied to Binance USDT perpetual daily candles for September 30, 2026:
| Market | Daily range | Exchange tick | Bucket width | Buckets across the range |
|---|---|---|---|---|
| BTCUSDT | 82,901.3 to 85,632.7 | 0.1 | $100 (1,000 ticks) | about 27 |
| ETHUSDT | 2,656.23 to 2,738.00 | 0.01 | $3 (300 ticks) | about 27 |
| MEUSDT | 0.07436 to 0.07934 | 0.00001 | $0.00025 (25 ticks) | about 20 |
| AIGENSYNUSDT | 0.02009 to 0.02088 | 0.00001 | $0.00025 (25 ticks) | about 3 |
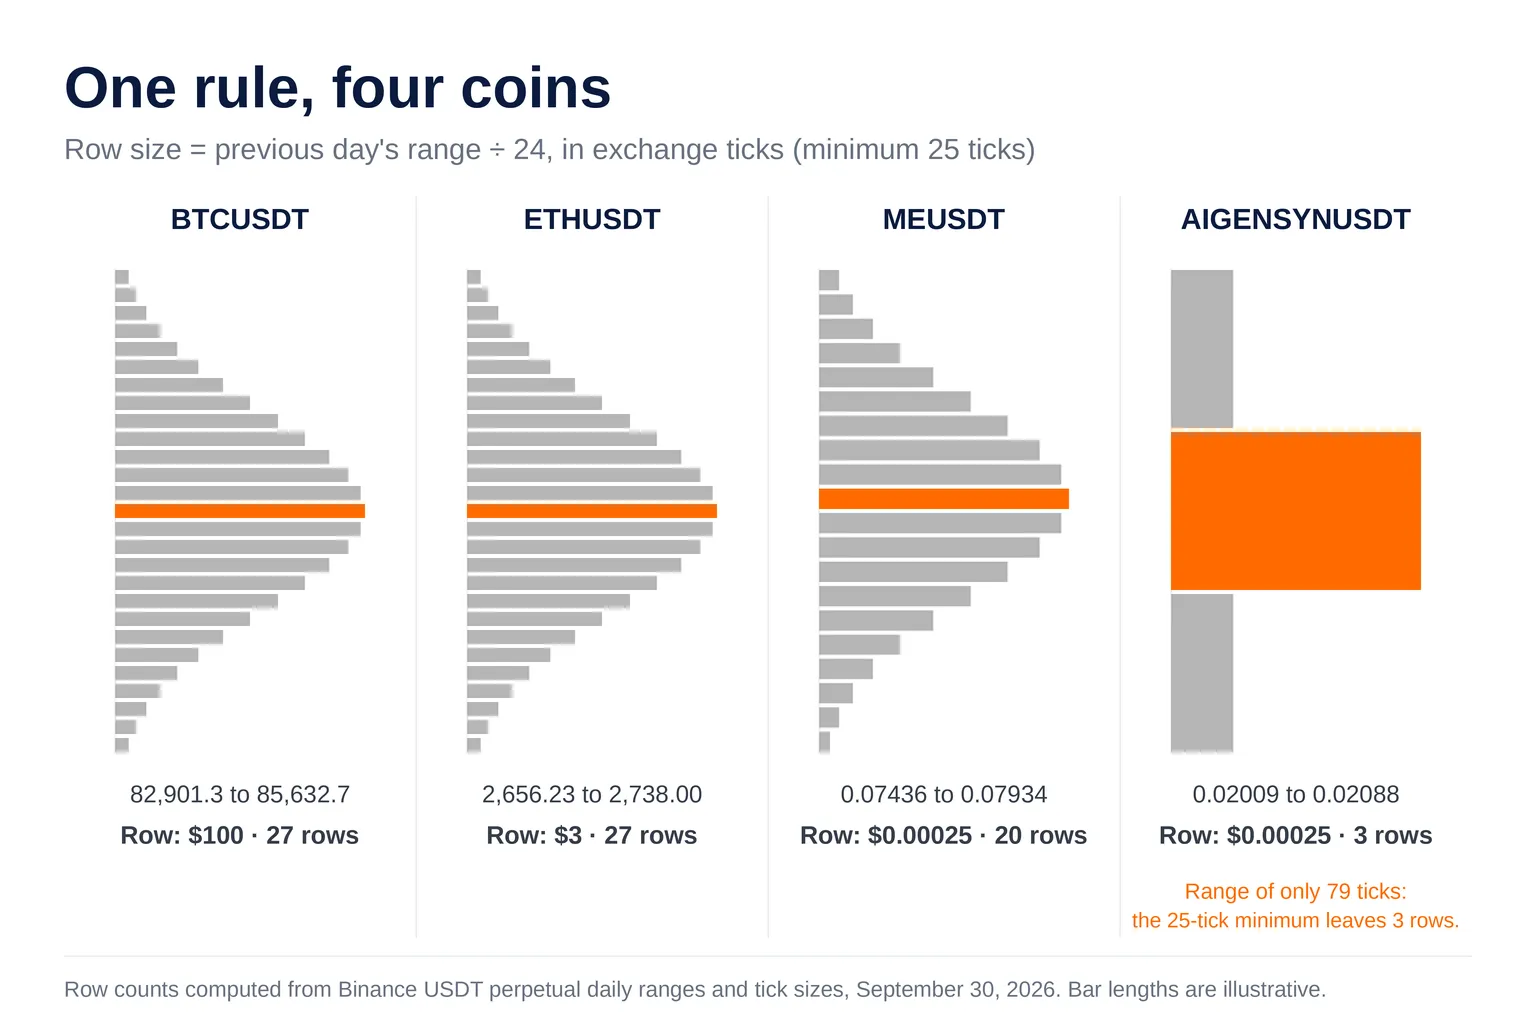
Take a trader who copies a $100 row setting from their BTC chart onto ME. ME’s whole day fits inside a single row, so the profile is one bar. Copy ME’s $0.00025 row back to BTC and the day’s range splits into roughly 11 million rows.
Neither profile is usable, and nothing about either coin is unusual. The setting was absolute; the coins are not.
The last row shows the rule’s limit. AIGENSYN moved only 79 ticks all day, so the 25-tick floor leaves about three buckets. On coins that trade in very few ticks, the exchange’s tick grid limits profile resolution before any formula does, and the POC is a wide band.
Volume profile strategies, and what the evidence says
Three volume profile strategies show up in almost every guide:
- POC revisit. Price that moves away from the prior POC tends to come back to it.
- Value area rejection. Price that probes outside VAH or VAL and fails to hold tends to rotate back into value.
- LVN traversal. Price that enters an LVN tends to cross it quickly toward the next HVN.
All three are reasonable hypotheses about auction behavior. Few guides show data for any of them.
What is the 80% rule in volume profile?
The 80% rule comes from Market Profile practice. If price opens outside the prior session’s value area, then moves back inside and holds there, the expectation is that it will travel to the opposite edge of that value area. The “80%” is the frequency the rule is said to work.
We have not found a primary source for that number, and we have not tested it. In crypto, it also needs a definition before it can be tested: there is no session open, so “opens outside value” has to mean something like “is outside value at 00:00 UTC.”
What happened when we tested “price returns to POC”
In June 2026, we tested the first strategy on AnomIQ’s own data: full-year 2025 Binance perpetual futures trades, replayed through AnomIQ’s metric pipeline into 1-minute bars. The signal was distance from the previous-day POC, standardized per symbol, pooled across 40 of 53 available symbols. The raw result looked strong: at a standardized distance of 2.5 or more, forward returns in the direction of the POC averaged +17.84 ± 1.14 bps at 1 hour and +33.62 ± 1.91 bps at 4 hours, over 399,055 observations.
Then we checked for overlapping samples. The POC is fixed for the whole day, so once price trends away from it, the distance stays extreme for hours. The raw test counted the same continuing episode 43 to 47 times. Counting each episode once:
- At a distance of 2.0 or more (16,999 episodes), forward returns were flat at every horizon, and every confidence interval included zero.
- At 2.5 or more (8,813 episodes), only the 4-hour horizon cleared zero (+28.25 ± 9.72 bps), one of seven horizons tested.
- At 3.0 or more (4,983 episodes), the sign flipped between horizons.
Per-symbol results were inconsistent and dominated by thin markets. We rejected the hypothesis. The lesson applies to every level in this article: anything anchored to a fixed daily reference (POC, VAH, VAL, an HVN or an LVN) will look better than it is unless each episode is counted once.
What volume profile cannot tell you
A volume profile is a record of where volume traded. Several things it does not show:
- Direction. A P-shape or a POC above current price says nothing about the next move.
- Who was aggressive. Each bucket sums buys and sells. A heavy bucket could be balanced trade or one side absorbing the other. Net Taker Imbalance separates them.
- Whether a level will hold. The profile shows where business happened, not whether the same participants are still there.
- Other venues. A profile built from one exchange’s trades describes that exchange’s market.
The useful pairing is location plus flow. The profile tells you price is at yesterday’s POC or inside an LVN. Order flow tells you what is happening there now: whether volume is unusual for this coin, which side is pressing, and whether price is responding. The crypto order flow guide covers that second layer.
Scanning volume profile levels across hundreds of markets
Drawing a profile works for the three or four coins you already watch. It does not scale to a list of a few hundred perpetuals, where a coin can sit at its previous-day POC all afternoon without anyone drawing the profile.
Picture a trader who follows six coins closely and wants to know when any perpetual on their exchange reaches yesterday’s POC with unusual volume. Checking that by hand means building a new profile for every coin, every UTC day. A scanner turns it into one condition, applied to every market:
Previous Day POC Distance Abs (%) < 0.3
AND Total Volume Z-Score (5m) > 2.0
That rule returns coins trading within 0.3% of the previous day’s POC bucket while 5-minute volume runs two standard deviations above the coin’s own baseline. It is a reason to open the chart, not a trade. The same structure works with Previous Day POC Distance Abs (%), Previous Day Value Area Distance (%), and the nearest HVN and LVN distance fields, each signed, measured to the nearest edge, and 0 inside the level.
The previous-day volume profile scanner guide walks through every filter and how they combine. You can build that scanner on the free plan: two scanners, 30-minute delayed data, no card.
FAQ
What is the 80% rule in volume profile?
The 80% rule is a Market Profile heuristic: if price opens outside the prior session’s value area, then moves back inside and holds, traders expect it to reach the opposite edge of value. The 80% figure is widely repeated but rarely sourced. In crypto, “opens outside value” needs a defined start time, such as 00:00 UTC, before the rule can be tested.
What does a volume profile tell you?
Where trading concentrated by price over a chosen window: the POC, the value area holding about 70% of volume, and the nodes around them. It does not tell you direction or which side was aggressive.
Is the TradingView volume profile accurate for crypto?
Yes, for the data and settings you give it. The two crypto-specific choices, session window and row size, change the output: a row size that suits BTC can collapse a low-priced altcoin into one or two rows.
What session should I use for a crypto volume profile?
Use the completed UTC day for a stable reference level. It matches the 00:00 UTC daily candle and stays fixed; rolling 24-hour and visible-range profiles keep moving.
Which is better, Market Profile or Volume Profile?
Neither is better in general. Market Profile counts time spent at each price; volume profile counts volume traded there, which crypto exchanges publish trade by trade.
Conclusion
Reading a volume profile in crypto comes down to five levels and two decisions:
- The POC is the busiest price band; the value area holds 70% of volume around it, bounded by VAH and VAL.
- HVNs mark acceptance and LVNs mark thin areas between heavier ones. Exact rules make both testable.
- Pick a fixed window. The completed UTC day is stable and comparable across coins.
- Size rows from each coin’s own range, not from a setting copied off another chart.
- Treat every level-based strategy as a hypothesis. Our POC-reversion test looked strong until each episode was counted once.
The profile tells you where price is relative to yesterday’s auction. It does not tell you what happens next. Pair it with order flow, and let a scanner watch the levels on coins you are not charting.
Open AnomIQ to scan previous-day POC, value area, HVN and LVN distance across every tracked market, or start with BTC’s live volume profile levels.