
POC Scanner: Alerts When Crypto Returns to Yesterday's Point of Control

Trader turned software engineer, with 4+ years building systems for crypto exchanges. Founder of AnomIQ, a real-time crypto anomaly scanner for quantitative traders.
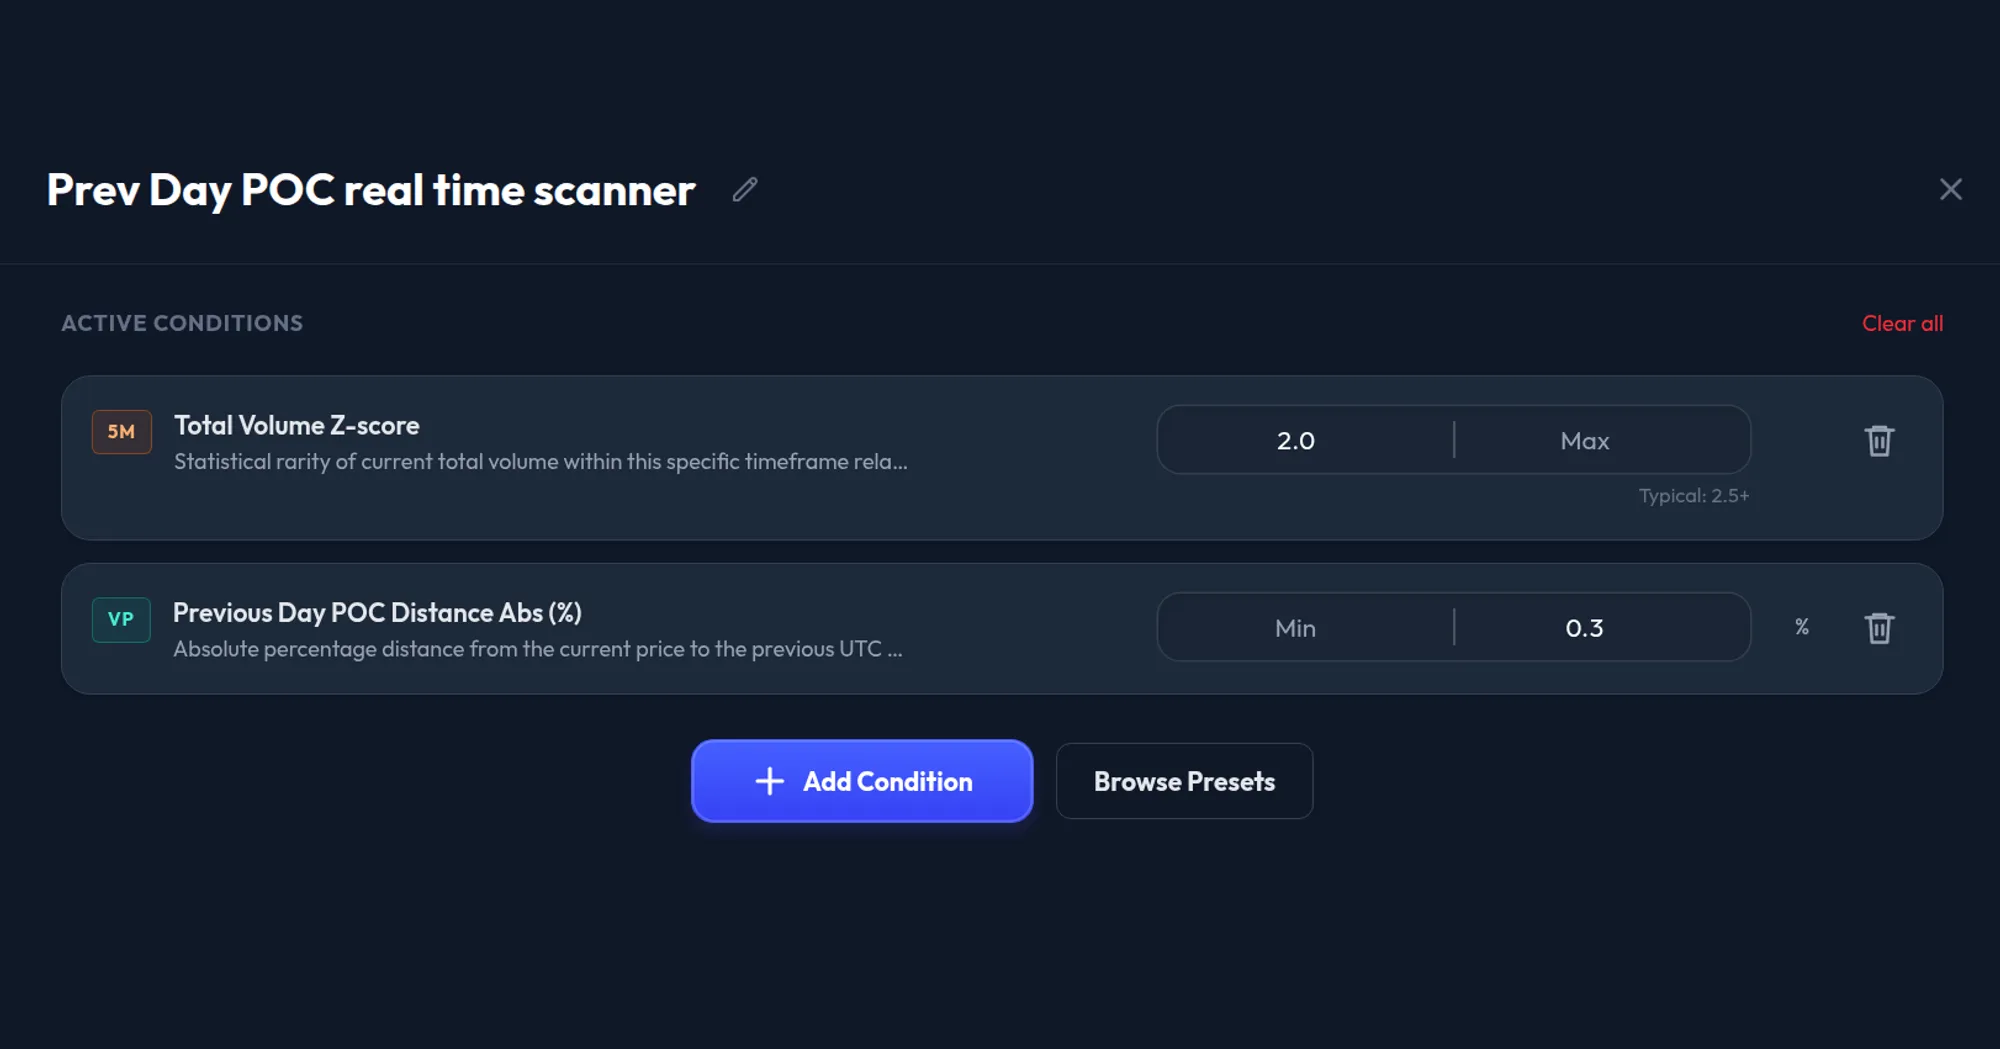
A POC scanner flags every crypto pair trading at or near yesterday’s Point of Control, the price bucket where the most volume traded in the previous UTC day, so you don’t have to draw a Volume Profile on each chart. If you only need today’s live Bitcoin levels, open theBitcoin Volume Profile POC tool instead.
Most traders who use Volume Profile apply it to three or four symbols they follow closely. They draw the profile, note where the Point of Control sits, and watch for price to return to that level. Across three coins, that workflow holds.
Across hundreds of active pairs, you need hundreds of Volume Profiles and as many price alerts, updated every morning. Nobody does that. The structural level gets missed on every coin you are not already charting.
That is the job of the POC scanner in AnomIQ: one Previous Day POC Distance filter, set once, watches every active pair and flags it when price trades within a defined percentage of the previous day’s Point of Control. The Bitcoin Volume Profile levels guide explains how to read every level the live BTC tool shows.
Key Takeaways
- A POC scanner checks every pair against yesterday’s Point of Control at once, instead of one hand-drawn Volume Profile per chart.
- AnomIQ sizes each coin’s volume buckets from its own prior-day range (range ÷ 24, rounded to a clean tick step, clamped to 25-20,000 ticks), so BTC and a $0.40 altcoin get comparable resolution.
- Previous Day POC Distance is signed and measured to the edge of the POC bucket, with 0 inside it. Use the Abs version, or a -0.3 to 0.3 range, for “near POC” scans.
- POC proximity says where price is, not what is happening there. Pair it with Total Volume Z-score or Taker Imbalance Z-Score.
What Is the Point of Control?
The Point of Control (POC) is the price level, or narrow price band, where the most volume traded during a session. It comes from a Volume Profile: a histogram mapping volume to price increments rather than time. A candlestick chart shows volume per bar. A Volume Profile shows volume per price level. The bucket with the highest accumulated volume is the POC. For the rest of the profile around it (value area, HVN, LVN and the D, P and b shapes), see how to read a volume profile in crypto.
High-volume nodes attract re-engagement. Participants who traded in size at a price level tend to re-enter or defend that level when price revisits. The POC marks where the most prior commitment from a session sits.
Returning to POC does not guarantee a reaction. It establishes a structural condition. Aggressive directional flow at the same moment gives that condition weight.
Why Yesterday’s POC
AnomIQ uses T-1: the Point of Control from the prior complete UTC day.
The current session’s POC shifts with every trade. It takes hours to stabilize and keeps accumulating until the session closes. Basing decisions on it means anchoring to a number that is still changing.
Yesterday’s POC is settled. Every trade from that UTC day counted. The highest-volume node is fixed. That is what participants from the previous session are watching when price returns.
VWAP resets each session for the same reason: completed data anchors; in-progress data is still being written.
For the full previous-day level set beyond just POC (VAH, VAL, HVN, LVN), see the Previous-Day Volume Profile Scanner. For the price extremes of the same prior day rather than its volume structure, see the previous day high/low (PDH/PDL) bounce strategy.
Why a POC Scanner Beats Per-Chart Alerts
Volume Profile access is not the problem. Drawing one and setting a POC alert is a per-chart manual operation. Fifty symbols means fifty profiles to maintain and fifty alerts to update each morning as the T-1 POC shifts. In practice, traders skip it and watch the same handful of coins they always do.
A mid-cap altcoin can spend two sessions testing its highest-volume node while nobody notices, because nobody drew that profile.
Set one condition in the scanner. It watches every pair and flags when the condition is met. You review the results.
The Adaptive Bucket Problem
Cross-market Volume Profile breaks on one constraint: bucket width.
A $5 bucket on BTC at $85,000 gives roughly 400 buckets across a normal daily range. Workable. Apply that same $5 bucket to a $0.40 altcoin and the entire instrument collapses into one bucket. Apply a $0.001 bucket to BTC and you get 85 million price increments, most empty, and the profile tells you nothing.
Fixed bucket sizes fail across instruments. Per-instrument manual calibration breaks every time an asset reprices. Neither works at scale.
AnomIQ sizes each bucket from the instrument’s own prior-day range.
The calculation:
Take the full price range of the last completed UTC day, high minus low, expressed in ticks: multiples of the instrument’s minimum price increment, its tick size. For the profile that becomes yesterday’s (T-1) POC, that is the range of the day before it (T-2).
Divide by 24. Roughly 24 buckets across a full day’s range gives enough resolution to locate the high-volume node without making the distribution sparse.
Round to a clean tick step. A range divided by 24 rarely lands on a round number. AnomIQ rounds to the nearest step on a 1-2-3-5-8 series at each power of ten: 10, 20, 30, 50, 80, 100 ticks, and so on. Buckets land on clean price increments for the instrument.
Clamp to valid range. A minimum of 25 ticks stops very quiet days from producing near-empty single-tick buckets. A maximum of 20,000 ticks caps bucket width on days with an extreme range.
BTC, ETH, a $0.40 altcoin: the same formula, different output widths. Each instrument’s bucket size reflects how it actually moves. No manual configuration per symbol.
How AnomIQ Computes the T-1 POC
The sequence per symbol, each UTC day:
Bucket width is set at the day boundary. When a new UTC day starts, AnomIQ takes the high-to-low range of the day that just finished and computes the new day’s bucket width from it. After a restart, it restores its saved state and loads any missing reference from the last completed daily trade summary before processing trades.
Bucket width is fixed.
bucketTicks = clamp(roundNice(dailyRangeTicks / 24), 25, 20000). Every trade that day assigns to buckets using this constant.Each trade accumulates into its bucket. AnomIQ converts the trade price to ticks, integer-divides by
bucketTicks, and accumulates volume at that bucket key.POC updates with each trade. The bucket with the highest volume at any point is the running POC. At day close, it becomes the T-1 reference.
The result is a band, not a point. The output is
bucketLowTickandbucketHighTick, a price range. Collapsing it to a single number claims precision that was never there.
The POC Scanner Filter: Previous Day POC Distance
Because the POC is a band, AnomIQ measures distance to the nearest edge of yesterday’s POC bucket, as a percentage of current price:
- Price inside the POC bucket:
0 - Price below it:
(current price − POC low) / current price × 100, a negative number - Price above it:
(current price − POC high) / current price × 100, a positive number
The scanner exposes two versions. Previous Day POC Distance (%) keeps the sign, so you can scan only for approaches from above or from below. Previous Day POC Distance Abs (%) drops the sign, which is what most “near POC” scans want.
Set Previous Day POC Distance Abs (%) below 0.3 and the scanner returns every symbol trading inside yesterday’s POC bucket or within 0.3% of its edge. Don’t put a plain ”< 0.3” on the signed field: it also matches every coin trading below the POC, however far below. Use a range of -0.3 to 0.3 there instead.
POC distance identifies one condition: price is near a level that mattered yesterday. What happens at that level is what the other filters read. The starting point will look like this:
Previous Day POC Distance Abs (%) < 0.3Most traders will add a second condition within the first session.
Building Confluence: POC Plus Flow
POC proximity tells you where price is, not what is happening there. These are useful filter combinations to pair it with.
POC proximity + Total Volume Z-score
Today Volume in $ > 500,000
AND Previous Day POC Distance Abs (%) < 0.3
AND Total Volume Z-score (5m) > 2.0
Volume two standard deviations above this instrument’s own historical baseline for that window, at the same price zone where the highest volume traded yesterday. Price hitting the level with unusual activity. Z-score normalization defines “anomalous” relative to each instrument’s own history, so the same threshold calibrates across BTC and a micro-cap. For the volume-specific version of that math, see Z-Score Volume Anomaly Detection in Trading. The Today Volume in $ floor keeps the rule off illiquid symbols where thin order books inflate z-scores trivially.
POC proximity + Taker Imbalance Z-Score
Today Volume in $ > 500,000
AND Previous Day POC Distance Abs (%) < 0.3
AND Taker Imbalance Z-Score (5m) > 2.5
Aggressive buyers initiating at an unusual rate at the price zone with the highest volume from the prior session. For the sell-side version, use Taker Imbalance Z-Score (5m) < -2.5. Net Taker Imbalance measures who is driving the tape. The z-score version compares that imbalance against the instrument’s own history, so a reading above 2.5 means buy-side dominance that is exceptional for this specific market, not just above a universal threshold.
Three conditions together
Today Volume in $ > 500,000
AND Previous Day POC Distance Abs (%) < 0.3
AND Total Volume Z-score (5m) > 1.8
AND Taker Imbalance Z-Score (5m) > 2.0
Structural level, elevated volume, directional aggression. Three filters this tight fire rarely. When they do, each result has more behind it than a single-condition scan would surface.
For how these metrics interact across timeframes, see How to Detect Crypto Volume Anomalies in Real Time.
What This Is Not
The POC distance filter is a scanner condition, not a chart overlay.
AnomIQ embeds a TradingView widget for price action. Drawing a full Volume Profile inside that panel, with the bucket distribution and POC highlighted, requires TradingView integration work that is not in this release.
What ships as a scannable filter threshold: Previous Day POC Distance, signed and absolute. When the scanner surfaces a symbol, you open it in TradingView, pull up Volume Profile, and read the chart. Thirty seconds. The scanner watched every pair. You review one.
For a live BTC-only view of those same POC, VWAP, value-area, HVN and LVN levels, open the Bitcoin Volume Profile POC Current tool.
POC vs VWAP: Two Different Questions
Both metrics use price and volume. They answer different questions.
| POC | VWAP | |
|---|---|---|
| What it measures | Price level with the highest volume concentration | Volume-weighted average price across the session |
| Output | A fixed price band (low tick to high tick) | A single number that moves continuously |
| When it settles | At session close. T-1 POC is immutable. | Resets each session, updates with every trade |
| Use case | Structural reference level where prior commitment concentrates | Fair value benchmark where price should revert intraday |
| Scanner use | Filter by distance from a fixed historical node | Filter by deviation from a live running average |
| Diverges from the other | When current session volume concentrates at a different price than yesterday’s node | When session price action is choppy or mean-reverting rather than trending |
VWAP and POC complement each other. VWAP tells you where price is relative to intraday fair value. T-1 POC tells you where the prior session’s highest-conviction trading happened. They often sit near each other in directional markets. When they diverge, the gap tells you something about how the current session differs from the prior one.
Frequently Asked Questions
What is the Point of Control in crypto trading? The price level where a session’s highest volume traded. A Volume Profile maps volume across price increments rather than time bars. The bucket with the most accumulated volume is the POC. Participants who traded in size at that level tend to re-engage when price revisits, which is why traders use it as a structural reference.
Why use yesterday’s POC instead of the current session’s? An in-progress POC shifts with every trade and takes hours to stabilize. T-1 is final: every trade counted, the level fixed. That is what participants from the previous session are watching when price returns.
How does AnomIQ handle bucket sizing across different assets? AnomIQ takes the instrument’s full price range from the last completed UTC day, converts it to ticks, divides by 24, rounds to a clean tick step, and clamps the result to between 25 and 20,000 ticks. BTC and a $0.40 altcoin get different dollar widths but comparable resolution relative to each instrument’s own daily range. No manual configuration.
What does POC distance percentage mean? How far current price sits from the nearest edge of the prior day’s POC bucket, as a percentage of current price. Zero means price is inside the bucket, negative means below it, positive means above it. The Abs version drops the sign, so Previous Day POC Distance Abs (%) below 0.2 flags every pair inside yesterday’s POC bucket or within 0.2% of it.
How is POC different from VWAP? VWAP is a running average: the average price paid per unit of volume, updated through the session. POC is a structural node: the price band where the most total volume accumulated in discrete buckets. They often land near each other in a trending session. In accumulation and distribution phases they diverge, which is when the distinction matters.
Can POC distance combine with other AnomIQ filters? Yes. Common pairings: POC distance with volume z-score to catch anomalous activity at the level, and with taker imbalance z-score to catch directional aggression there. Multi-condition filters cut the noise.
Setting Up a POC Scanner in AnomIQ
The T-1 POC calculation runs live in the backend. AnomIQ computes a fresh Volume Profile for every active pair each UTC day and settles the POC as the day rolls over.
Previous Day POC Distance (%) and its Abs version are live as configurable thresholds in the scanner builder, available to every AnomIQ user now. Pair them with Total Volume Z-score or Taker Imbalance Z-Score using the filter combinations above.