
Previous Day High/Low (PDH/PDL) Bounce Strategy for Crypto

Trader turned software engineer, with 4+ years building systems for crypto exchanges. Founder of AnomIQ, a real-time crypto anomaly scanner for quantitative traders.
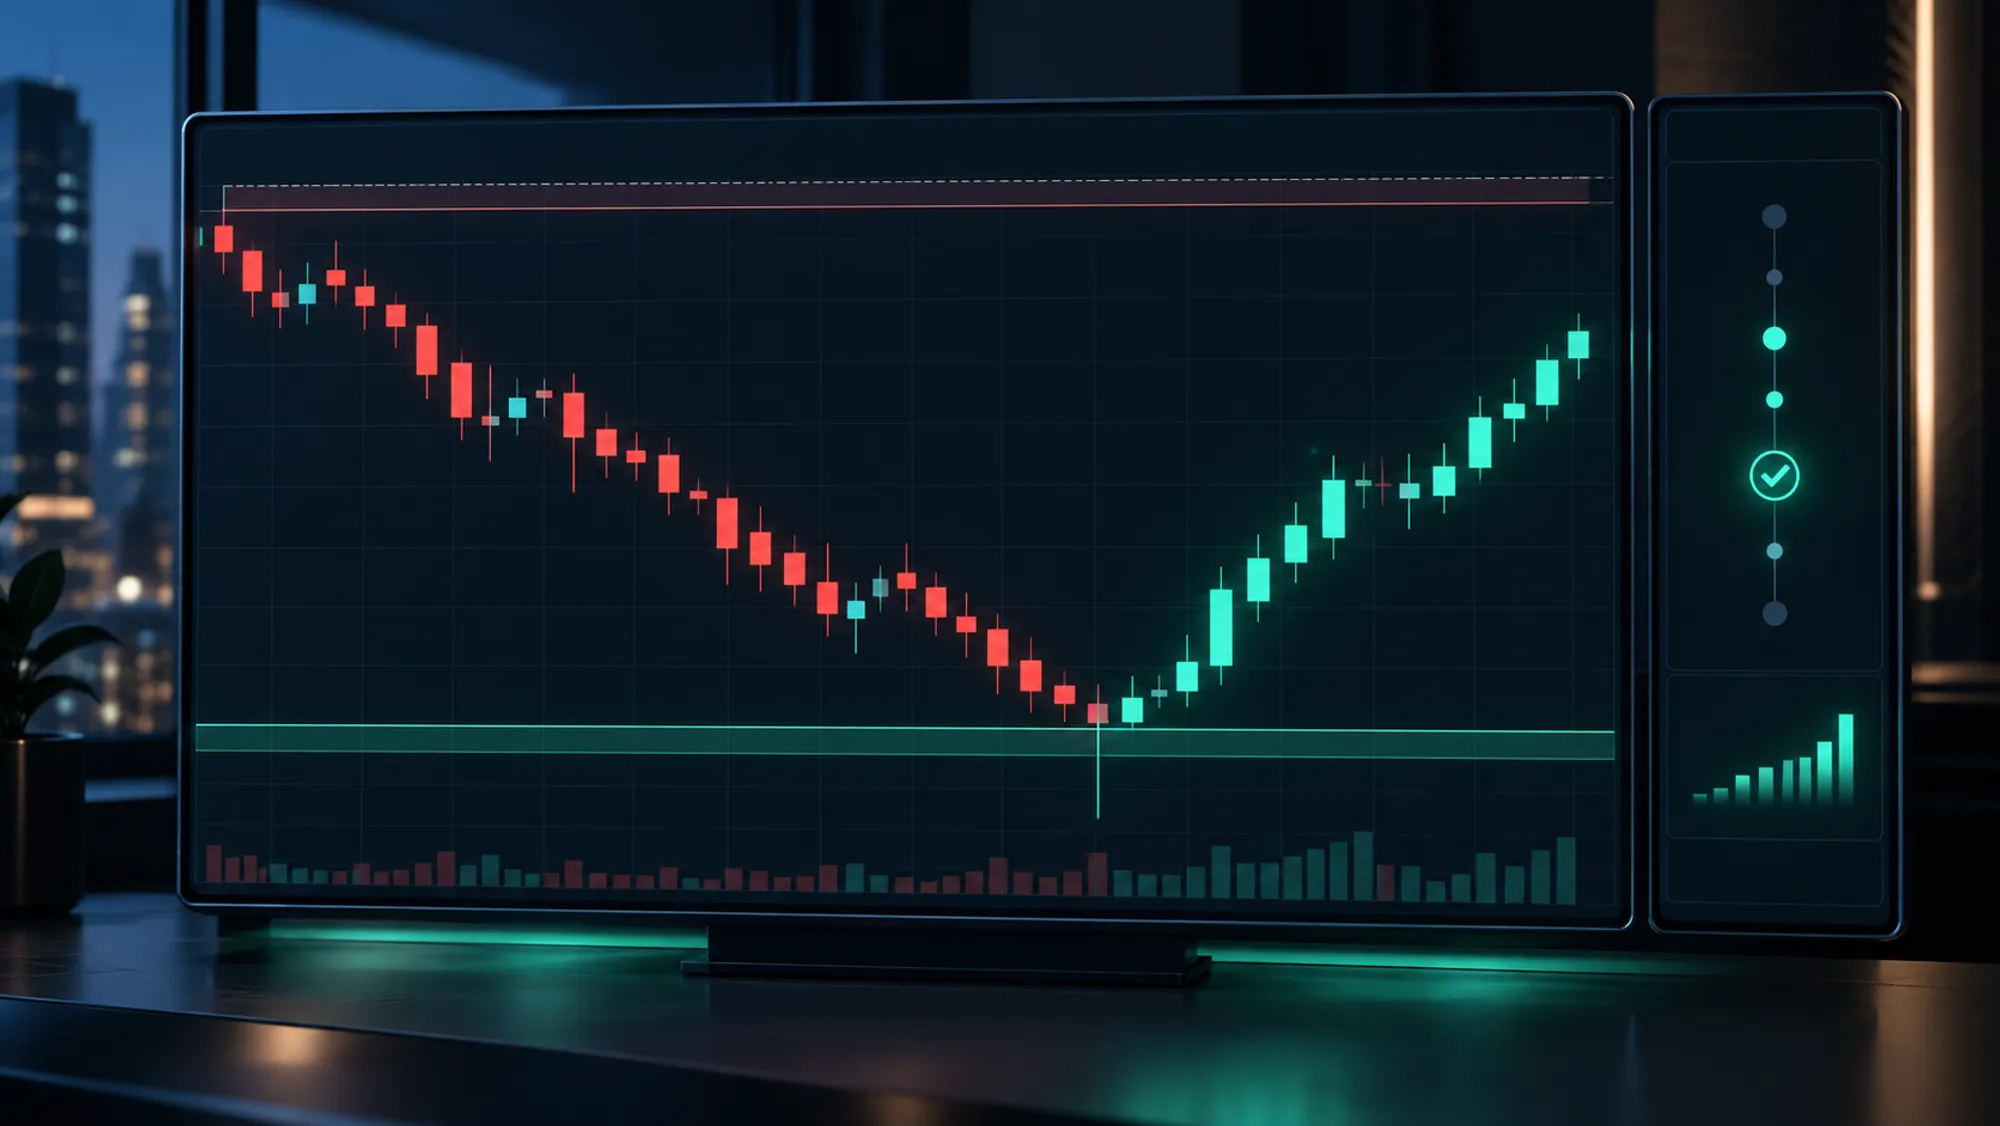
A previous day high/low (PDH/PDL) bounce is a trade off yesterday’s extremes: price returns to the prior day’s high or low, reacts, and recovers. The setup has two conditions: price tests the PDH or PDL (within about 0.3% on a liquid large cap), and the current timeframe shows a recovery that is unusual for that coin (on BTC, a five-minute gain well under 1% already qualifies; on a volatile altcoin, 2% or more). Together they separate a reaction at the level from a random touch.
You identify these setups by marking yesterday’s range on any chart. You execute them with hard stops and defined targets. You scale them with automation, so the setups on coins you are not watching still reach you.
This is Article 1 of a 3-article series on daily high/low bounce trading.Part 2 covers order flow confirmation; Part 3 is a complete system that adds trend and structural context.
Key Takeaways
- PDH and PDL are the previous day’s high and low. Many traders watch them and place stops and orders around them, which is why price often reacts there.
- A bounce setup forms when price tests the PDH or PDL AND the current timeframe shows a recovery that is unusual for that coin. The 0.3% band is a starting point for liquid large caps. The recovery threshold should be relative to the coin: 2% in five minutes is routine for a volatile altcoin and extreme for BTC.
- Enter on the recovery candle, place the stop beyond the tested level, and target the opposite side of yesterday’s range. Risk no more than 1-2% of the account per trade.
- Manual bounce detection doesn’t scale past a handful of coins. Automation monitors the setup across every tracked market.
- AnomIQ has no PDH/PDL distance filter today. The closest scanner version is a fresh intraday extreme plus a rebound that is large for the coin: New UTC-Day Low (15m), Volatility Z-Score (5m) above 2, and a positive Current (TimeFrame) Return (5m).
What Are PDH and PDL (Previous Day High and Low)?
PDH (previous day high) and PDL (previous day low) are the highest and lowest prices of the prior completed trading day. In crypto, that day usually runs from 00:00 to 24:00 UTC. If BTC’s range yesterday was $63,800 to $65,200, the PDH is $65,200 and the PDL is $63,800.
These levels matter because they are the most visible reference points on any intraday chart. Many traders mark them, set alerts on them, and place stops and orders around them. A long position opened near yesterday’s high and held through a decline has an obvious exit when price returns there. A short opened near yesterday’s low has an obvious cover level. When enough participants watch the same price, it tends to produce a reaction: not a guarantee, but a place worth watching.
Note what these levels are not: they are not where the most volume traded. In a daily volume profile, the extremes are usually thin tails, and the heaviest volume sits at the Point of Control. If you want the volume-based prior-day levels (POC and value area), see the previous-day volume profile scanner guide or check them on the live BTC volume profile tool. For a standard definition of PDH and PDL outside crypto, Capital.com’s day-trading explainer is a good reference.
AnomIQ approaches the same idea from the current session: New UTC-Day High and New UTC-Day Low flag when a coin has just printed a strict new high or low since 00:00 UTC inside the selected 5m, 15m, or 60m window. That is a fresh extreme forming today, not a stored prior-day level.
“Previous Day” in a 24/7 Market
Stock traders get PDH and PDL for free: the session opens and closes at fixed times. Crypto never closes, so “yesterday” depends on the day boundary your data uses.
Binance’s daily candles and AnomIQ’s New UTC-Day High/Low both reset at 00:00 UTC. A platform that uses a different day boundary, or an exchange app showing a rolling 24-hour high and low, will give you different levels from the ones most traders are marking. A rolling 24-hour window is the one to be most careful with: its high and low move every minute, so they are not fixed reference levels at all.
Two practical rules:
- Pick one day boundary (00:00 UTC is the common choice) and use it for every coin and every chart.
- If a level is not where you expect, check which day boundary your chart or data source uses before assuming the market ignored it.
This is a detail most PDH/PDL guides skip, because they were written for markets with a closing bell.
Why Bounces Happen at Daily Highs and Lows
Three forces tend to produce a reaction at the PDH and PDL:
1. Trapped Traders
A trader who bought at yesterday’s high and watched price fall all day is now holding a losing position. If price returns to that high, it is their chance to exit near breakeven.
Many of them leave sell orders there. When price approaches, that supply shows up. The same thing happens in reverse at the low: traders who shorted near yesterday’s low and watched price recover are underwater, and a return to the low is their chance to cover, which adds buy orders at the level.
This is a behavioral tendency, not a rule. It shifts the odds of a reaction at the level; it does not guarantee one, which is why the setup needs a confirmation condition and a stop.
2. Structural Support and Resistance
In support and resistance analysis, a prior session’s low acts as reference support for the new session, and a prior high acts as reference resistance. If the market reacted at a level yesterday, traders expect it may react there again, and many place orders accordingly.
This doesn’t always work. Support breaks. But enough traders plan their orders around these levels that the reaction is worth watching for.
3. Thinning Liquidity at Extremes
Price extremes (the prior day’s high and low) often have lower passive liquidity: fewer limit orders sitting to absorb market-order volume. When price approaches, aggressive orders can move price quickly in either direction. A small amount of buying pressure can push price up through the high; a small amount of selling can push it back down. That volatility attracts scalpers and traders looking for quick reversals.
How to Mark the Previous Day High and Low
Pull up any crypto chart on TradingView or your exchange. Set the timeframe to the 1D (daily) and confirm the daily candle closes at 00:00 UTC. The highest price the coin reached during yesterday’s candle is the previous day high (PDH). The lowest price is the previous day low (PDL).
Write these down or set price alerts on them.
For BTC, if yesterday’s range was $64,000 to $67,000:
- PDH: $67,000
- PDL: $64,000
- Today, watch for price to approach one of these levels
The reason this is so simple is also the reason it’s so easy to miss at scale. Tracking one or two coins by hand is manageable. Across 50 coins, you need 50 separate alerts. Across 200 coins, manual tracking becomes invisible. Most traders only watch the handful of coins they already follow, and miss the setups on everything else.
The Real Bounce Signal: Distance + Recovery
Here’s where most bounce traders get it wrong. They see price touch the prior-day low and enter immediately. That’s premature. What separates a real bounce from a fake-out is simple: recovery.
A real bounce has two components:
Component 1: Distance to the PDH or PDL
Price must actually test the level, not just get close.
Definition: Price is within a small band of the PDH or PDL. For a liquid large cap like BTC, 0.3% is a reasonable starting band.
Why 0.3%, and when to change it: On a $64,000 BTC level, 0.3% is $192. That’s close enough to reach the stops and resting orders clustered around the level, and tight enough to exclude price that is merely drifting nearby. But 0.3% is not a universal constant. On a small cap whose normal 5-minute range is 2%, a 0.3% band is noise. Scale the band to the coin’s own typical range rather than applying one number everywhere. The same argument is made at length in why fixed thresholds fail across coins.
Component 2: Current Timeframe Return
Price must show recovery, not collapse further.
Definition: The current 5-minute or 15-minute window return is positive and large enough to be unusual for that coin. On a volatile altcoin that can mean 2%+ on the 5-minute; on BTC, a five-minute gain well under 1% is already unusual.
Why this matters: If price hits the PDL but the current candle closes down -1%, that’s a breakdown, not a bounce. If price hits the PDL and the window closes up sharply for that coin, shorts are covering and buyers are stepping in. That’s a bounce forming. For advanced traders: this recovery window is where absorption often shows up. High volume with limited price progress gets replaced by directional volume with clear upward movement.
Scale it to the coin: a 2% 5-minute recovery is an extreme move for BTC and a routine one for a volatile small cap. What you want is a recovery that is unusual for that coin on that timeframe. Volatility Z-Score measures whether the window’s high-low range is unusual against the coin’s own history; paired with a positive return, it describes a recovery that is large for that coin, so the same threshold works for BTC and a mid-cap altcoin.
Mechanical Entry Rule: Distance + Recovery
Once both components align, execution is simple:
Entry Signal
When price:
- Tests the PDH or PDL (within the distance band), AND
- The current timeframe shows a recovery that is unusual for that coin
Enter on the close of the recovery candle, or on a breakout above it.
Worked example (illustrative prices, not a recorded trade):
- BTC’s previous day range: $64,000 (PDL) to $67,000 (PDH)
- Price drops to $64,080, within 0.3% of the PDL (0.125% away)
- First 5-minute candle: opens at $64,100, closes at $65,020 (+1.5% from the low)
- Not quite 2% yet. Wait.
- Second 5-minute candle closes at $65,840: +2.7% from the $64,080 low
- Entry: long at $65,840
- Stop: $63,900, just below the PDL (risk $1,940 per BTC)
- First target: the PDH at $67,000 (reward $1,160 per BTC)
Look at the reward-to-risk: about 0.6 to 1. Waiting for a full 2%+ recovery, which is already an extreme move for BTC, used up most of the distance to the PDH before entry. That is the real cost of a large fixed confirmation threshold, and a reason to scale it to the coin’s volatility (a smaller recovery that is still unusual for the coin gets you in earlier) or to demand a wider range between PDL and PDH before taking the trade.
Exit (Profit Target)
The first profit target is the opposite side of yesterday’s range: the PDH for a long off the PDL.
If the bounce reaches that level, take some profit (half the position or more). If it breaks through, you can trail a stop or hold for the next resistance level.
The trade is invalidated if price closes back below the PDL you bounced from. That is where the stop belongs: just beyond the tested level, not an arbitrary percentage below entry.
Risk Management: Protecting Your Account
Bounces fail. Support breaks. Your thesis on recovery can be wrong. Here’s how to survive:
1. Use Hard Stops, Not Mental Stops
A mental stop is a price level you tell yourself you’ll exit at. But when price touches it, fear or hope overrides your decision, and you hold. Then price keeps falling, and you suffer a much larger loss than you planned.
A hard stop is a stop order placed with the exchange when you enter: a stop-market order, or a stop-limit order if you accept the risk of it not filling in a fast move. For a long off the PDL, the stop sits just below the PDL. When that price trades, the order triggers automatically. You don’t have to make another decision.
(A plain limit sell order is not a stop. Placed below the current price, it would fill immediately.)
2. Scale Out at the First Target
If your target is the PDH, sell half your position there and let the other half run. You realize part of the gain and cut your exposure.
Then move the stop on the remaining half up to your entry price. From that point, the worst case on the rest of the trade is roughly breakeven, before fees and slippage.
3. Risk No More Than 1-2% Per Trade
Risk no more than 1-2% of your account per bounce trade. Traders who risk 5% or 10% because a setup “looks obvious” run into a string of normal losses they can’t absorb.
Size the position from the stop distance, not the other way around. If your account is $10,000:
- 1% risk = $100 max loss per trade
- 2% risk = $200 max loss per trade
In the worked example, the stop is $1,940 below entry per BTC. A $200 risk budget allows a position of about 0.1 BTC ($200 / $1,940).
The rule: never risk more than 2% per trade, no matter how clean the setup looks.
Why Bounces Trap Traders in Downtrends
The single biggest mistake bounce traders make is not checking context.
In an uptrend (higher highs and higher lows), a bounce off the prior-day low is trading with the larger structure. A recovery candle there signals buying interest that agrees with the trend, which is the stronger version of the setup.
In a downtrend (lower highs and lower lows), that same bounce is often a trap. Price approaches the prior-day low, recovery candle forms, traders enter longs expecting a bounce, and then price falls through the low and continues downward. The “bounce” was just profit-taking on a short-term rally inside a larger downmove.
Before trading any daily high/low bounce:
- Check the 4-hour or daily chart for trend direction
- If price is in a clear downtrend with lower highs and lower lows, skip daily-low bounces (wait for resistance instead)
- If price is in an uptrend, daily-low bounces have the trend on their side
Trend context separates a level test worth investigating from one worth skipping. The complete daily bounce trading system turns this into a rule and ties position size to it.
Bounce vs Breakout at the PDH and PDL
Every PDH/PDL test resolves one of two ways: price rejects the level (a bounce) or price accepts beyond it (a breakout, or a breakdown at the low). Many PDH/PDL guides trade the breakout side; this article trades the bounce. The two are the same observation read in opposite directions.
What separates them is acceptance. A bounce shows a quick rejection: price trades through or near the level, then recovers back inside yesterday’s range within a few candles. A breakout shows price closing beyond the level and staying there, with follow-through rather than a snap back.
When price trades through the level, triggers the stops beyond it and then closes back inside, traders call it a liquidity sweep. In a test of 9,798 daily-low breaks on crypto perpetuals, the sweeps and the breakdowns looked the same at the moment of the break; the close back inside was what told them apart.
That is why the bounce trade’s stop sits just beyond the tested level. A close below the PDL is the exact event that would turn your bounce into a breakdown, so it is also the point where the bounce idea is wrong.
In AnomIQ, the same fields read the other way describe the breakout case: New UTC-Day High with a positive Current (TimeFrame) Return is a coin extending to fresh highs rather than rejecting them. Decide in advance which of the two you are trading, and don’t switch your read mid-trade.
Common Mistakes Traders Make
Mistake 1: Entering Before Recovery
Price touches the PDL. It’s right there. You want in.
But wait. Is there a recovery candle yet? Is the current timeframe showing a recovery that is unusual for this coin? Or are you just staring at a price touch with hope?
Most traders enter here. Price falls through the level 2 candles later. They get stopped out, frustrated, and swear off the setup forever.
The cost of waiting one candle is minimal. The cost of entering early is usually your stop-loss. Wait for the recovery signal.
Mistake 2: Ignoring Liquidity
A small-cap altcoin with $50K daily volume has a prior-day high and low, sure. But when you enter a bounce with a market order on thin liquidity, your order moves price 1-2%. That’s not edge. That’s slippage eating your profit target.
Add a liquidity floor: only bounce trade coins with $500K to $1M daily volume or higher (adjust based on your position size). This removes setups where your own order is large enough to move the price. AnomIQ’s Liquidity Score covers a related risk: it is the share of the last 1,440 minutes in which the coin traded at all. Pair a minimum Liquidity Score with the Today Volume in $ floor. Neither shows you the spread, so size the order to the volume you see.
Mistake 3: Holding Too Long (Greedy Exits)
Bounces are fast. You enter the recovery candle, price rallies into the PDH, and you watch it. “Maybe it’ll break through. Maybe 5%…”
Bounces can reverse sharply, sometimes back through your entry within a few 5-minute candles. You get caught holding the wrong side.
Take partial profit at the PDH as planned. Exiting at the target you set before entry is following the plan, not leaving money on the table.
Mistake 4: Mixing Levels
The PDH and PDL are one type of level, but they’re not the only ones. Round numbers like $65,000, a swing high from three days ago, a moving average: these are all potential reaction points too.
The problem: a reaction at a round number is weaker evidence than a reaction at a PDH or PDL that has already been tested and held. Levels that coincide (a PDL that is also a recent swing low) carry more weight than a level on its own. Not all levels are equal.
Why Manual Bounce Detection Doesn’t Scale
Here’s what you’re good at now: identifying daily high/low bounces manually. You know the distance metric. You know to wait for recovery. You could probably walk up to a chart, see the setup, and execute a trade correctly.
On one or two coins? Perfect.
But how many crypto pairs are worth watching? Hundreds of liquid pairs trade across major exchanges. On any given day, some of them test a daily extreme and recover while you are looking at something else.
This is the retail trader trap. You know the setup. You just don’t see most of the occurrences, because you only watch the handful of coins you already follow.
The scalable workflow is to stop staring at charts and let automation do the discovery:
- Automation watches every tracked market for the pattern (extreme + recovery)
- An alert fires the moment conditions are met
- You spend 30 seconds reviewing the chart and trend context
- You decide whether it is worth acting on
Manual chart-staring can’t compete with this workflow. Advanced traders layer in order flow scanning at the bounce point, confirming the distance + recovery with directional aggression data, but the core signal is still price + distance.
Scaling Bounce Detection: Real-Time Automation
AnomIQ does not have a PDH/PDL distance filter today. The scanner version of this setup uses the current session instead: a fresh intraday low followed by a rebound that is large for that coin.
Today Volume in $ > 500000
AND New UTC-Day Low (15m) = true
AND Volatility Z-Score (5m) > 2
AND Current (TimeFrame) Return (5m) >= 0.1
New UTC-Day Low is true while a strict new low since 00:00 UTC sits inside the 15m rolling window. Volatility Z-Score asks whether the 5m window’s high-low range is unusual for this coin, and a positive Current (TimeFrame) Return means the window closed above where it opened. Together they describe a coin that just made a new daily low and rebounded hard by its own standards. Because both thresholds are relative, the same rule works on BTC and on a small cap. Mirror it with New UTC-Day High and a negative return for the short side.
Current (TimeFrame) Return is measured from the first price in the window, not from the low. That matters for the worked example above: its recovery comes in two candles of about +1.4% and +1.3%, so no single 5m window shows +2%, and a fixed Current (TimeFrame) Return (5m) > 2% rule would likely miss it. The relative rule catches it, because a 1.3% five-minute range is far outside BTC’s normal range. On volatile altcoins, a fixed 2% floor still works; on BTC and ETH, a 5m gain that large is rare.
The previous-day levels AnomIQ does scan are volume-based: Previous Day Value Area Distance (%) and Previous Day POC Distance measure how far price is from yesterday’s value area and Point of Control. They are not the PDH and PDL, but they are prior-day reference levels you can filter on today.
Instead of checking charts manually, the alert tells you:
- What to look at (one coin, not 50 others)
- Why now (fresh daily extreme + rebound forming)
It does not tell you the rebound will hold. That part is still your read of the chart, the trend, and the order flow.
Then you spend 30 seconds checking the 5-minute chart to confirm trend context. If price is in an uptrend and the recovery is real, you enter. If you see signs of a downtrend, you skip it.
Real-time high/low detection with recovery confirmation transforms bounce trading from a hobby you fit around chart-watching into a scalable, repeatable process. For traders who want to add a conviction layer, Net Taker Imbalance at the bounce point shows whether aggressive buyers are driving the rebound, rather than price momentum alone. Part 2 of this series builds that layer.
FAQ
What do PDH and PDL stand for?
PDH is the previous day high and PDL is the previous day low: the highest and lowest prices of the prior completed trading day. In crypto, which trades 24/7, the day boundary is usually 00:00 UTC. Traders use PDH and PDL as reference levels for bounces, breakouts, and stop placement on the following day.
What is the difference between a daily high/low bounce and a daily support/resistance bounce?
They describe the same idea. The previous day high acts as a reference resistance level and the previous day low as a reference support level for the next session. Both are levels from the prior complete trading day that many traders watch and place orders around.
How often do daily high/low bounces fail?
Often enough that a stop-loss is not optional. There is no fixed failure rate: it shifts with trend, liquidity, and volatility regime. Bounces against a clear downtrend are structurally weaker than bounces inside an uptrend, which is why trend context belongs in every entry decision. If you want a number for your own markets, test the rule on your own data before sizing it.
Can I trade daily high/low bounces on the 4-hour chart or the 15-minute chart?
Yes. The concept works on any timeframe. A 4-hour high/low bounce will have a different risk-reward than a 15-minute bounce, but the logic is the same. Price approaches a structural level from the prior complete candle, recovery forms, and you enter. Just make sure your stop-loss and target are appropriate for the timeframe’s volatility.
What timeframe return should I wait for before entering?
There is no single number that works across coins and timeframes. A 2% recovery on the 5-minute chart is an extreme move for BTC and a routine one for a volatile small cap, and a longer candle needs a larger move than a shorter one to mean the same thing. The robust rule is relative: wait for a recovery that is unusual for that coin on that timeframe, measured against its own typical range. In AnomIQ, that is Volatility Z-Score (5m) above 2 with a positive window return. A fixed 2%+ on the 5-minute works as a floor on volatile altcoins, not on BTC.
Is the daily high/low bounce a complete trading system?
No. It’s a single setup within a larger trading framework. Use it alongside other context: trend direction, liquidity, volume. A bounce in an uptrend with good liquidity is stronger than a bounce alone. Treat it as one signal in a multi-signal framework, not as a standalone edge.
Conclusion
Previous day highs and lows matter because many traders watch them and place orders around them. That creates a tendency for price to react at the PDH and PDL, not a guarantee.
The mechanical setup is simple: price tests the PDH or PDL, then shows a recovery that is unusual for that coin. For liquid large caps, 0.3% is a reasonable starting band; make the recovery threshold relative to the coin, since 2%+ on the 5-minute is routine for a volatile altcoin and rare for BTC. Enter on the recovery candle, put the stop just beyond the tested level, and target the other side of yesterday’s range. Check that the reward-to-risk still makes sense after waiting for confirmation. Context (uptrend, not downtrend) and discipline (hard stops, fixed risk per trade) decide whether the setup is worth taking. Nothing makes it work every time.
The catch is scale. You can trade bounces on a handful of coins you watch by hand, but most occurrences happen on coins you are not looking at.
Monitoring is the part automation solves: surface the setups across every tracked market, review the chart yourself, then decide.
Open AnomIQ and build the scanner version: New UTC-Day Low (15m), Volatility Z-Score (5m) above 2 and a positive Current (TimeFrame) Return (5m), with a Today Volume in $ floor. It watches every tracked market and flags coins making a fresh daily extreme and rebounding hard by their own standards. The scanner does discovery. You review and decide.
Real-time alerts are on the paid plan. On the free tier (no credit card required), the same matches arrive 30 minutes late: enough to study the setup and review what it surfaces on coins you weren’t watching, but not to act on a 5-minute recovery.