
Crypto Order Flow Trading: Taker Flow and Scanner Rules

Trader turned software engineer, with 4+ years building systems for crypto exchanges. Founder of AnomIQ, a real-time crypto anomaly scanner for quantitative traders.
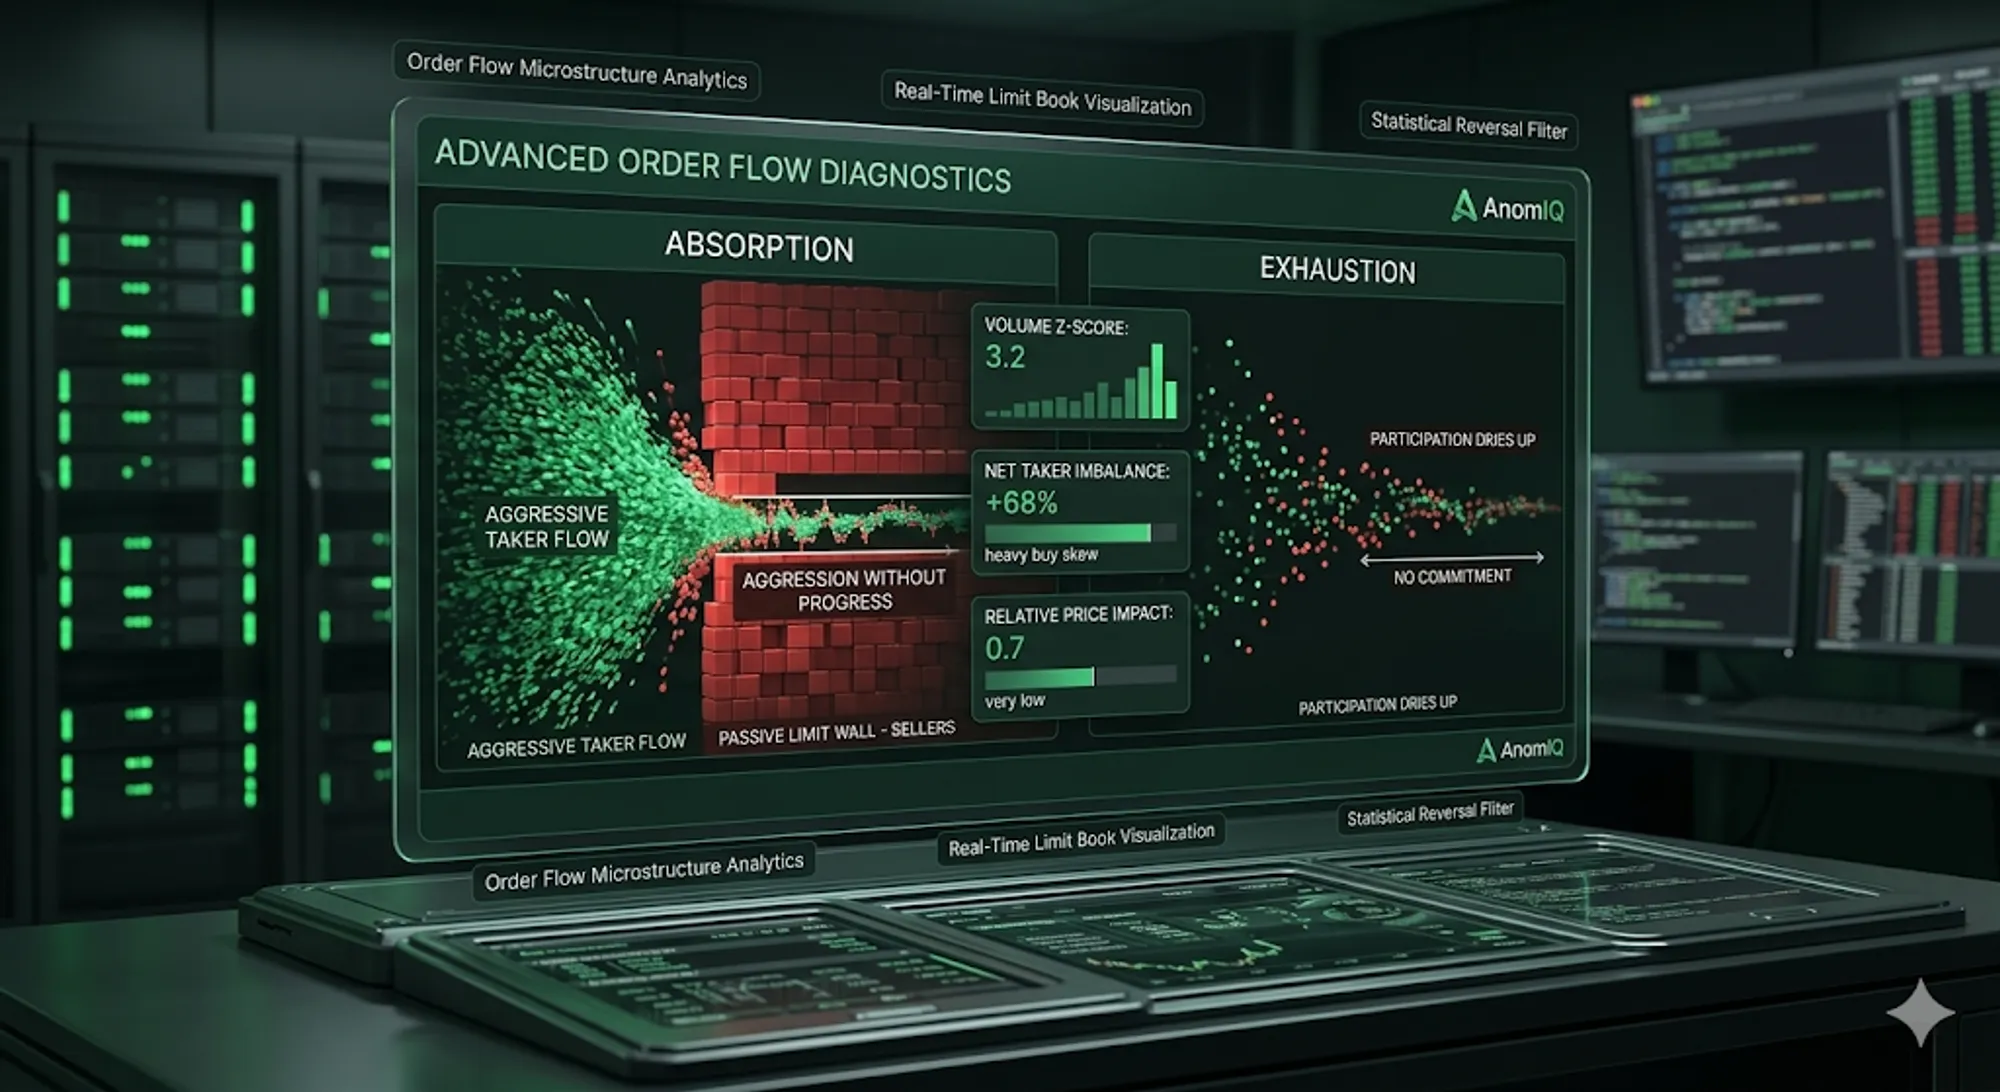
Crypto order flow is the live record of executed buying and selling pressure: who initiated trades, how aggressively they acted, how much liquidity they consumed, and whether price moved efficiently in response. Order flow trading reads that record to judge which side controls the current window.
Most crypto order flow trading content assumes one chart, one DOM, one market.
That works when you are executing a single setup. It breaks when you need to watch hundreds of spot and perp pairs at once.
At that scale, order flow has to become a rule set: abnormal participation, directional taker flow, price efficiency, liquidity context and, on perpetual futures, open interest. Forget predicting every tick. The scanner’s job is to find markets where the current flow is statistically different from that symbol’s own baseline.
For AnomIQ, the scanner-native version matters most. You define the conditions. The market tells you where they are active.
Key Takeaways
- Read crypto order flow in a fixed order: liquidity, abnormal participation (Volume Z-Score), taker direction (Net Taker Imbalance), price efficiency (Relative Price Impact), then open interest on perpetuals.
- Raw Net Taker Imbalance gives direction. Taker Imbalance Z-Score tells you whether that imbalance is unusual for this symbol. Cross-symbol scans need both.
- Absorption is one-sided aggressive flow that fails to move price. Extreme volume with imbalance near zero is a different state: a two-sided standoff.
- On perpetuals, price up with buy-dominant flow and falling open interest can be short covering rather than new long demand.
- Start with one plain rule on the 5m, then check whether the 15m and 60m confirm before adding conditions.
Where this order flow guide fits
Use this page as the hub workflow: start with liquidity, add abnormal participation, confirm taker direction, check whether price moved efficiently, then add derivatives and location context only when the setup needs them.
The narrower guides cover the layers separately:
| If you need | Use |
|---|---|
| The baseline math behind abnormal volume | Z-Score Volume Anomaly Detection and Z-Score in Trading |
| The difference between contained flow and fading flow | Order Flow Absorption vs Exhaustion |
| Live examples of absorption and exhaustion | Absorption vs Exhaustion in Order Flow: 3 Crypto Examples |
| Perpetual futures positioning context | Open Interest Scanner |
| Location filters for the same order-flow event | Previous-Day Volume Profile Scanner |
| Broad research on what predicts large moves | What Predicts a Big Crypto Move? 16,726 Events Tested |
That separation matters. This article is not another absorption guide or z-score explainer; it is the decision chain for combining those signals into scanner rules.
Order flow is not just volume
Volume is the blunt instrument. It tells you how much traded, but not who crossed the spread, whether price accepted the flow, or whether the book absorbed it.
A $10 million candle always has a buyer and a seller. The better question is narrower: which side paid for immediate execution?
That side is the taker.
| Market data | What it tells you | What it misses |
|---|---|---|
| Volume | How much traded | Direction and urgency |
| Candle return | Where price ended | Whether the move was efficient or absorbed |
| Order book depth | Resting liquidity at visible prices | Which liquidity actually traded |
| Taker flow | Who initiated execution | Whether the flow is unusual for this symbol |
| Cumulative volume delta (CVD) | Which side has been more aggressive over the session | Whether the current window agrees |
| Open interest | Whether perp positions expanded or contracted | Which side initiated without taker context |
Order flow starts producing signal when those fields are read together.
For the basic maker/taker mechanics, Binance Academy has a primer on market makers and market takers. For order book structure, see its explanation of how order books work. Footprint charts are one visual interface for this data; Investopedia summarizes them as charts that overlay volume, bid-ask and liquidity data onto candles in its footprint chart guide.
AnomIQ uses the same market structure, but expresses it as scanner logic.
The five order flow fields that matter
A crypto order flow scanner does not need every microstructure field. Five categories carry most of the signal.
| Field group | Example AnomIQ metric | Question answered |
|---|---|---|
| Liquidity | Today Volume in $, Liquidity score 0-100 | Is the symbol liquid enough to trust short-window flow? |
| Participation | Volume Z-Score, Buy Volume Z-Score, Sell Volume Z-Score | Is current activity unusual for this symbol? |
| Direction | Net Taker Imbalance, Taker Imbalance Z-Score | Are aggressive buyers or sellers controlling the window? |
| Price efficiency | Relative Price Impact, Current Window Return | Did the flow move price, or was it absorbed? |
| Perp positioning | OI Change % (5m to 240m) | Are new positions opening or existing positions closing? |
Read them in this order:
Is the market liquid?
Is participation abnormal?
Which side is aggressive?
Did price move efficiently?
Is perp positioning expanding or closing?
The order matters. If you start with volume, you will misclassify absorption as continuation.
High volume can mean continuation. It can also mean absorption, exhaustion or mechanical short covering. You need the rest of the context.
Net Taker Imbalance is the direction layer
Net Taker Imbalance measures whether aggressive flow in the current window is buy-dominant or sell-dominant. See the full NTI explainer for worked examples.
Net Taker Imbalance = ((Buy Taker Volume - Sell Taker Volume) / Total Taker Volume) x 100The output runs from -100 to +100:
| Reading | Typical interpretation |
|---|---|
| Near 0 | Balanced aggressive flow |
| +15 to +30 | Buyers gaining control |
| +30 and higher | Strong buy-side aggression |
| -15 to -30 | Sellers gaining control |
| -30 and lower | Strong sell-side aggression |
Raw NTI earns its place because the number is easy to read. A +35 reading means buy-initiated volume dominated the current window.
Raw NTI carries direction, not rarity. Some symbols have persistent structural bias. One contract may trade with slightly positive taker imbalance during normal conditions, while another stays balanced. A universal NTI > 25 threshold over-alerts on the first symbol and misses the second.
For cross-symbol scans, normalize the imbalance. The Taker Imbalance Z-Score asks the better question:
Is the current imbalance unusual for this symbol?For a market-wide scanner, use both:
Taker Imbalance Z-Score (5m) > 2.0
AND Net Taker Imbalance (5m) > 15
The z-score confirms abnormality. Raw NTI confirms direction.
NTI reads the current window. Session CVD Notional reads the UTC day: aggressive buy notional minus sell notional since 00:00 UTC, the scanner’s version of cumulative volume delta. A 5m buy imbalance that fires while session CVD is negative is flow pushing against the session’s dominant side. Treat CVD as context, not confirmation: it can stay positive while price weakens, when passive sellers absorb earlier buying.
Volume Z-Score is the participation layer
Directional flow needs participation behind it. A +35 NTI on tiny volume can be a random short-window print.
Volume Z-Score is the participation gate. It compares current volume against that symbol’s own historical baseline.
Volume Z-Score = (Current Volume - Historical Mean Volume) / Historical StdDev VolumeUse side-specific versions when direction matters:
- Buy Volume Z-Score for aggressive buy-side participation
- Sell Volume Z-Score for aggressive sell-side participation
- Total Volume Z-Score when you care about two-sided participation or absorption
In AnomIQ, begin with one of these:
Buy Volume Z-Score (5m) > 2.5or:
Sell Volume Z-Score (5m) > 2.5That first condition says something unusual is happening now.
The taker imbalance condition says which side is initiating it.
Relative Price Impact separates momentum from absorption
The better order-flow question is not “was there buying?” It is “did the buying move price?”
Relative Price Impact measures price movement relative to abnormal volume. It helps separate efficient directional flow from absorbed flow.
Two examples:
| Setup | Volume Z-Score | NTI | Current Return | Relative Price Impact | Read |
|---|---|---|---|---|---|
| Efficient continuation | High | Strongly positive | Positive | High | Buyers consume liquidity and price moves |
| Absorption | High | Strongly one-sided | Flat | Low | Aggressive flow runs into passive liquidity; price does not follow |
The trap in a lot of manual order-flow reads: aggressive buying appears, so the read becomes continuation. But if price barely moves while abnormal volume prints, absorption is the cleaner read.
Bad scanner logic:
High buy volume = bullishBetter scanner logic:
High buy volume + positive NTI + positive return + high RPI = efficient buy-side continuation
High volume + one-sided NTI + flat return + low RPI = absorption
Same volume. Different market structure.
Four crypto order flow patterns worth scanning
The rules below use the names from the metrics glossary. Two read differently in the scanner’s filter list: Current Window Return is Current (TimeFrame) Return, and open interest change is OI Change % (15m). The (5m), (15m) and (60m) suffixes tell you which timeframe to select for each filter.
1. Directional continuation
Continuation is the least ambiguous pattern: abnormal volume, directional taker flow and price movement all point the same way.
Example buy-side continuation rule:
Today Volume in $ > 500,000
AND Liquidity score 0-100 > 80
AND Buy Volume Z-Score (5m) > 2.5
AND Taker Imbalance Z-Score (5m) > 2.0
AND Net Taker Imbalance (5m) > 20
AND Current Window Return (5m) > 0.25
This scan catches the case where buyers are unusually aggressive, volume is abnormal, and price is moving with the flow.
This rule leaves Relative Price Impact out on purpose. RPI divides the move by the volume multiple, so a 5m window with abnormal volume needs an outsized move to score high: RPI above 1.0 on 3x volume takes a 3% return. RPI does its best work on the absorption side, where it stays low while flow stays one-sided.
For implementation detail around filter construction, see Multi-Timeframe Crypto Scanner Filters.
2. Order flow absorption
Order flow absorption occurs when one-sided aggressive flow runs into passive liquidity and price does not move in proportion.
A buy-side absorption scan:
Today Volume in $ > 500,000
AND Total Volume Z-Score (5m) > 3.0
AND Net Taker Imbalance (5m) > 60
AND Relative Price Impact (5m) < 0.8
For sell-side absorption, use Net Taker Imbalance (5m) < -60.
An absorption scan is not a buy or sell signal by itself. It is a market-structure flag: aggressive flow hit the tape and price did not follow.
Keep the volume and price-impact conditions and move the imbalance band to zero, and you find a different state. Both sides are crossing the spread in similar size. That is a two-sided standoff, not absorption:
Today Volume in $ > 500,000
AND Total Volume Z-Score (5m) > 3.0
AND Net Taker Imbalance (5m) BETWEEN -15 AND 15
AND Relative Price Impact (5m) < 0.8
A standoff ends when one side stops showing up. The STBL-USDT example shows one: Volume Z-Score held between 16 and 24 for four minutes while imbalance stayed near zero, then sellers took over.
Location comes next. Absorption near a previous-day POC, VAH, VAL, HVN or LVN has more information than absorption in the middle of a range. Previous-day volume profile levels provide that map.
3. Exhaustion after a directional move
Exhaustion is different from absorption. Absorption is flow meeting opposing liquidity. Exhaustion is participation fading after a move has already extended.
An exhaustion scan can look for:
Current Window Return (15m) > 1.0
AND Buy Volume Z-Score (5m) < 0
AND Net Taker Imbalance (5m) BETWEEN -10 AND 10
AND Total Volume Z-Score (5m) < 0.5
AND Relative Price Impact (5m) < 0.5
This reads as: price moved, but active flow is no longer supporting the move.
No reversal is guaranteed. The signal is simpler: the continuation condition has weakened. That beats a directional opinion.
4. Short covering on perpetual futures
Crypto perpetuals add one field that spot markets do not have: open interest.
One price move can mean two different things:
| Price | Taker flow | Open interest | Interpretation |
|---|---|---|---|
| Up | Buy-dominant | Rising | New long positioning |
| Up | Buy-dominant | Falling | Shorts closing |
| Down | Sell-dominant | Rising | New short positioning |
| Down | Sell-dominant | Falling | Longs closing |
A perp order-flow scan is incomplete without open interest.
Potential short-covering rule:
Market = BINANCE_PERPS
AND Buy Volume Z-Score (5m) > 2.5
AND Net Taker Imbalance (5m) > 20
AND Current Window Return (5m) > 0.5
AND OI Change % (15m) < -0.5
The same rule runs on Hyperliquid with Market = HYPERLIQUID.
Reading this as new demand is a mistake. It is a forced-positioning read: price is rising while open interest contracts.
For a detailed case study, see Price Up, Open Interest Down.
Use volume profile as the location layer
Order flow gets sharper when it prints at a level that already matters.
An aggressive taker-flow event in the middle of a range can still matter, but it is harder to interpret. Move that event to yesterday’s POC, near a high-volume node, or through a low-volume node, and the read gets structure.
Start with these combinations:
| Location | Order flow confirmation |
|---|---|
| Near previous-day POC | Total Volume Z-Score + one-sided NTI + low RPI for absorption |
| Break through LVN | Directional NTI + high Relative Price Impact |
| Rejection at VAH or VAL | Sell/Buy Volume Z-Score against the level |
| Return to HVN | Volume Z-Score + falling RPI for acceptance |
A scanner that only detects activity creates noise. A scanner that detects activity at known prices gives you a better review queue.
For the full location framework, use the Previous-Day Volume Profile Scanner and the Point of Control Scanner.
A practical crypto order flow scanner template
Begin with one plain directional rule. Make it boring on purpose. Split it into specialized variants only after you understand the alerts.
Today Volume in $ > 500,000
AND Liquidity score 0-100 > 80
AND Total Volume Z-Score (5m) > 2.5
AND Taker Imbalance Z-Score (5m) > 2.0
AND Net Taker Imbalance (5m) > 15
AND Current Window Return (5m) > 0.20
That template finds abnormal buy-side order flow with actual price movement. For the sell-side version, invert the final two directional conditions:
AND Net Taker Imbalance (5m) < -15
AND Current Window Return (5m) < -0.20
Then branch:
| Branch | Add |
|---|---|
| Buy-side continuation | Net Taker Imbalance > 20 and Current Window Return > 0 |
| Sell-side continuation | Net Taker Imbalance < -20 and Current Window Return < 0 |
| Absorption | Raise imbalance to Net Taker Imbalance > 60 and replace the return condition with Relative Price Impact < 0.8 |
| Perp squeeze/covering | Open interest falling while price moves against crowded positioning |
| Location-based setup | Previous-day POC/HVN/LVN distance near zero |
| Coin-specific divergence | Low 1H BTC correlation against a high 24H BTC baseline |
That last branch matters when you want order flow that is not just riding Bitcoin. The BTC Correlation Scanner covers the 1H versus 24H correlation filter for finding altcoins decoupling from BTC.
Starting with 18 conditions is how you overfit the scanner before you know which alerts deserve attention.
Use 5m for detection, 15m for confirmation, and 60m for regime context. If the 5m fires but the 15m stays quiet, treat it as a short event. If the 15m joins, the event has persistence. If the 60m aligns, the market may be shifting regime rather than printing a one-off burst.
Common mistakes in crypto order flow trading
Treating raw volume as directional
Volume is symmetric. It tells you activity increased, not who controlled the window. Pair it with taker imbalance before assigning direction.
Ignoring liquidity
Short-window order flow on thin symbols is fragile. Require a notional volume floor and a Liquidity Score floor before trusting z-scores, imbalance or price impact. Liquidity Score is the share of the last 1,440 minutes with at least one trade: 80 means the market traded in roughly four of every five minutes.
Reading perp moves without open interest
On perpetual futures, price up plus buy-dominant taker flow can be new longs or short covering. Open interest separates the two.
Assuming absorption predicts direction immediately
Absorption identifies tension. It does not tell you when the market resolves. Wait for follow-through: RPI recovering while imbalance stays one-sided (the passive side gave way), imbalance fading toward zero (the aggressive side stopped), or price escaping the absorbed level.
Using one timeframe only
The 5m window catches early events. It also catches noise. Use 15m and 60m to decide whether the event persisted.
FAQ
What is order flow trading in crypto?
Order flow trading in crypto means reading executed trades, taker aggression, liquidity response and price movement to understand whether buyers or sellers are controlling the current market window.
Is crypto order flow the same as volume?
No. Volume measures how much traded. Order flow separates who initiated the trades, how one-sided the flow was, and whether that flow actually moved price.
What is the best order flow metric for a crypto scanner?
Net Taker Imbalance is the best starting point for direction, but it should be paired with Volume Z-Score, Relative Price Impact and a liquidity gate. For cross-symbol alerts, Taker Imbalance Z-Score is usually more reliable than raw imbalance alone.
How do you detect order flow absorption?
Look for elevated Volume Z-Score, strongly one-sided Net Taker Imbalance, and low Relative Price Impact with little price movement. That combination means aggressive flow is trading into passive liquidity without moving price. If imbalance sits near zero instead, both sides are aggressive: that is a two-sided standoff, not absorption.
How is order flow different on crypto perpetuals?
Perpetual futures add open interest. A buy-side taker surge with rising open interest suggests new long positioning, while the same surge with falling open interest can be short covering.
Related order-flow guides
- What Predicts a Big Crypto Move? 16,726 Events Tested
- Net Taker Imbalance: Formula, Examples and Scanner Rules
- Absorption vs Exhaustion in Order Flow: 3 Crypto Examples
- Price Up, OI Down: Short Covering or Profit Taking?
- Bitcoin Volume Profile POC Scanner for Crypto Alerts
- BTC Correlation Scanner: Altcoins Decoupling From Bitcoin
- Multi-Timeframe Crypto Scanner Filters: How to Layer Rules
Crypto order flow earns its keep when you can repeat the read.
Stopping at “buyers were aggressive” or “volume was high” leaves too much to memory. Build the scanner around the full chain: liquidity, abnormal participation, taker direction, price efficiency, location and open interest.
On the free tier, these rules run on 30-minute delayed data with up to 2 scanners. Real-time alerts and Telegram or NTFY delivery are on the paid plan.