
Multi-Timeframe Crypto Scanner Filters: How to Layer Rules

Trader turned software engineer, with 4+ years building systems for crypto exchanges. Founder of AnomIQ, a real-time crypto anomaly scanner for quantitative traders.
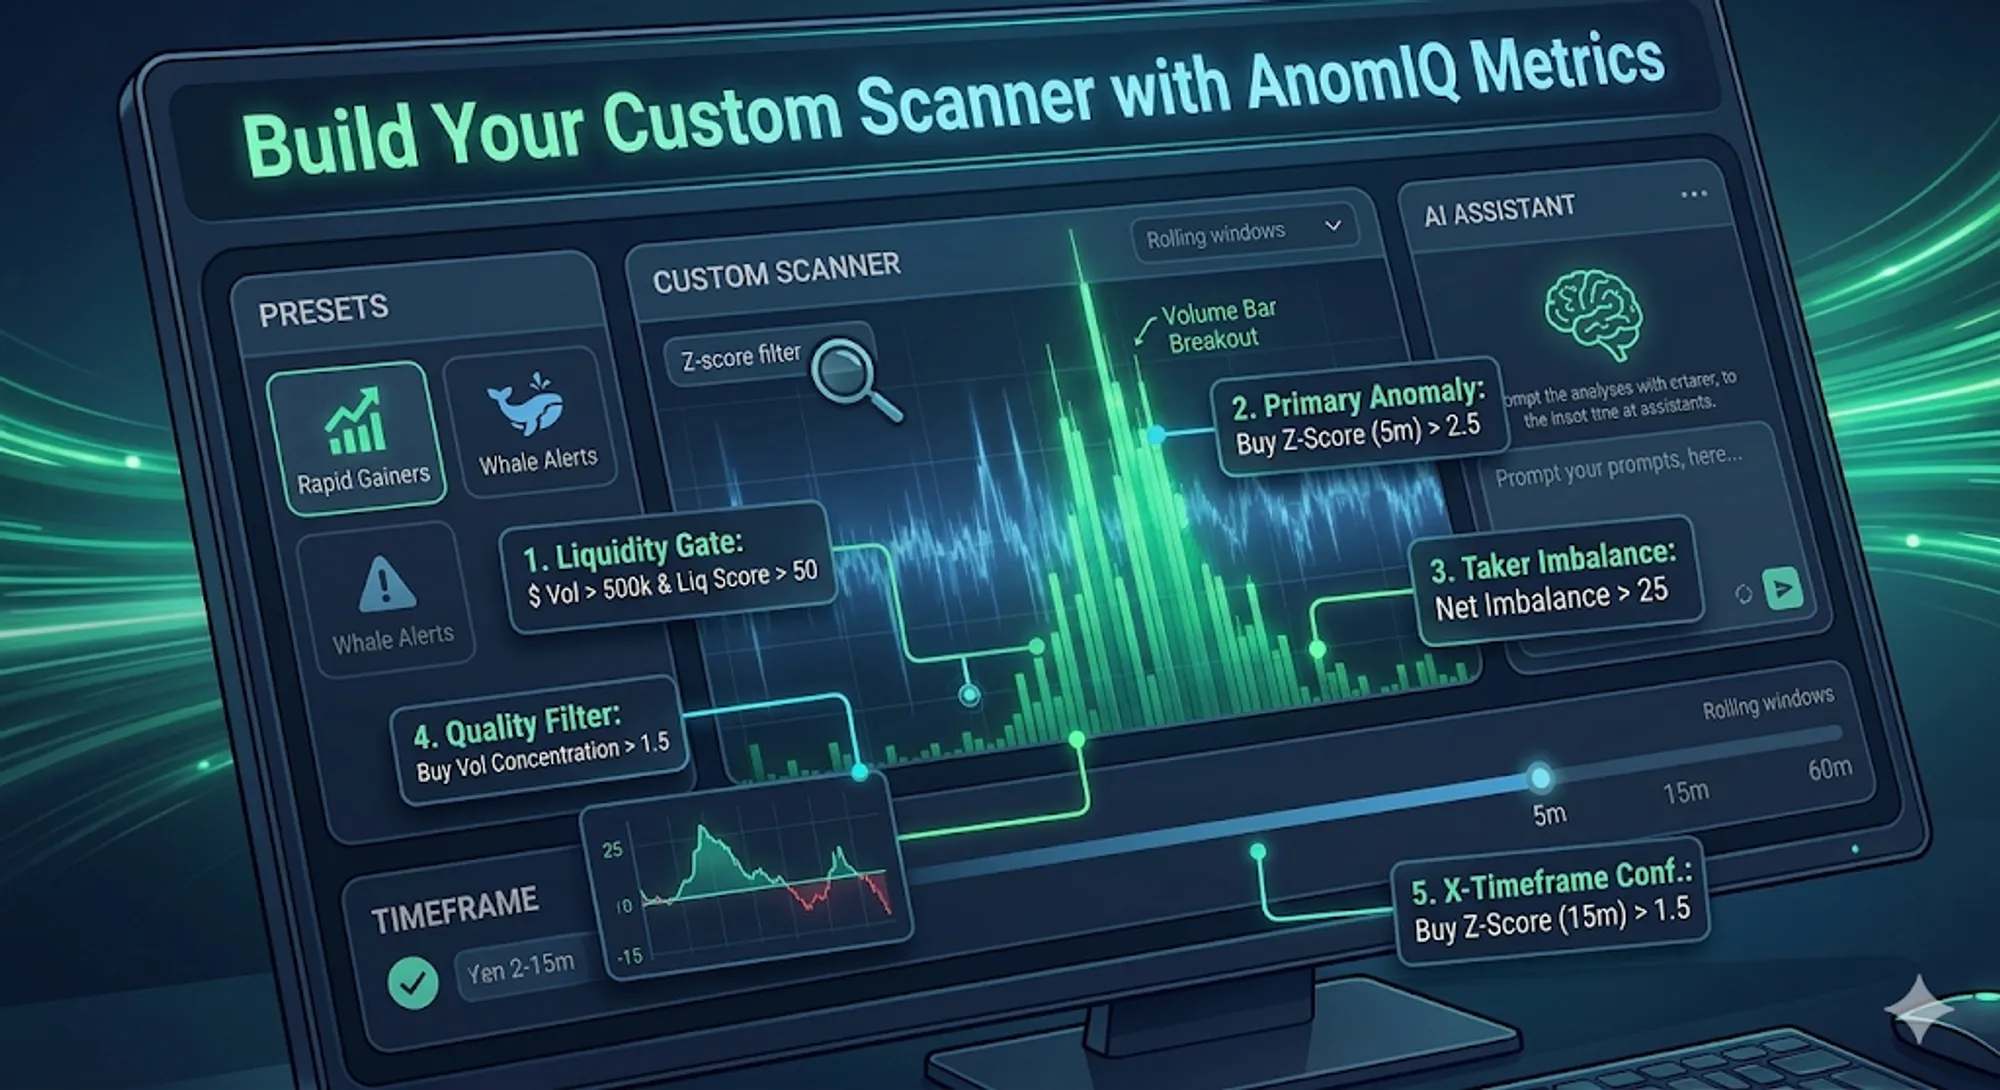
A custom crypto scanner is a rule-based market filter that evaluates live symbols against statistical thresholds, directional flow, and liquidity constraints. In AnomIQ, one rule can mix rolling 5m, 15m and 60m windows, and every z-score compares the current window with that symbol’s own recent history.
Most scanners fail for one reason: they mix good metrics with weak rule design.
If you want alerts that fire on the same market behavior every time, you need three things:
- A liquidity gate to remove noise.
- A primary anomaly signal with direction.
- A check on the next timeframe up, so a spike has to be unusual on the longer window too.
This guide explains how the three timeframes are built, then how to layer crypto scanner filters on top of them, with templates you can paste directly.
Key Takeaways
- Each timeframe is a rolling window of completed 1-minute bars plus the bar still forming: 4+1 for the 5m, 14+1 for the 15m, 59+1 for the 60m.
- Z-scores compare that window with the symbol’s own earlier windows: roughly the previous hour for the 5m, five hours for the 15m and a day for the 60m.
- Build rules in layers: liquidity gate, one primary anomaly, directional confirmation, a trade-quality filter, then the next timeframe up.
- A 15m condition filters out spikes that are only unusual on the 5m, but one extreme minute can clear both. Test persistence separately.
- Use absolute thresholds only for liquidity floors, and z-scores for every anomaly condition.
How do 5m, 15m, and 60m scanner timeframes work?
Each timeframe is a rolling window of completed 1-minute bars plus the bar still forming:
| Timeframe | Completed bars | Forming bar | Baseline: earlier windows of the same length |
|---|---|---|---|
| 5m | 4 | 1 | 60, roughly the previous hour |
| 15m | 14 | 1 | 300, roughly the previous five hours |
| 60m | 59 | 1 | 1,440, roughly the previous day |
For z-scores, the platform uses:
z = (live_value - historical_mean) / historical_stddevWhere:
live_valueis the current window’s value (for volume, the window total)historical_meanandhistorical_stddevcome from that symbol’s earlier windows of the same length, listed in the table above. The current window is left out of its own baseline.
Four consequences matter when you write rules:
- The 5m reacts fastest. Each new minute is a fifth of the 5m window, a fifteenth of the 15m and a sixtieth of the 60m.
- Readings build through the minute. The forming bar is partial, so a window’s volume total grows as trades arrive, and a z-score can clear its threshold before the minute closes.
- Short windows forget quickly. An extreme minute stays in the 5m window for about five minutes, then rolls out. The 15m and 60m hold it much longer.
- A zero can mean “no history yet.” Until a baseline holds 30 windows, the z-score reads 0. Right after a listing or a data gap, a zero means not enough history, not normal activity.
Taker-flow imbalance as a short-horizon predictor of price drift is well-established in market microstructure literature; see Cartea, Jaimungal, and Penalva, Algorithmic and High-Frequency Trading (Cambridge University Press, 2015). Z-score normalization of volume and flow variables is the standard way to make that signal comparable across instruments with different baselines.
AnomIQ’s own 16,726-event study is a useful check on that idea: after extreme volume-imbalance events on 39 Binance perpetuals in 2025, 12-hour moves of 250+ basis points with and against the imbalance split almost evenly (3,546 vs 3,559), and taker flow at event time didn’t separate them. Treat imbalance as a way to decide where to look, not as a direction call.
For a deeper statistical explanation, see Z-Score in Trading. For a chart-only version of the same volume anomaly idea, see the free TradingView Volume Anomaly Indicator.
Which core metrics do you actually need?
You do not need 40 fields to start. You need a small set that captures activity, direction, and quality.
Each rolling metric in the table below exists on every timeframe (5m, 15m, 60m). In the UI the label doesn’t carry the timeframe: you pick it from the 5m, 15m or 60m tab in the condition picker. In filter syntax we write the timeframe in parentheses after the field, e.g. Buy volume Z-score (5m). Two fields read differently in the picker: Current Window Return is Current (TimeFrame) Return, and Trend Cleanliness is Trend Cleanliness (Body/Range %).
| Purpose | UI field | What it measures |
|---|---|---|
| Liquidity gate | Today Volume in $, Liquidity score 0-100 | Is this symbol liquid enough for reliable signals |
| Activity anomaly | Buy volume Z-score / Sell volume Z-score | Is side-specific volume statistically unusual |
| Direction | Net Taker Imbalance | Who is initiating aggressively (buy vs sell) |
| Normalized direction | Taker Imbalance Z-Score | Is imbalance unusual for this symbol |
| Trade quality | Buy Volume Concentration / Sell Volume Concentration | Is volume concentrated in larger trades |
| Confirmation | Same metrics on the next timeframe up | Is the event also unusual on the longer window |
The three derived identities worth remembering:
Intensity Z-Score = Total volume Z-score - Total trade count Z-score
Buy Volume Concentration = Buy volume Z-score - Buy trade count Z-score
Sell Volume Concentration = Sell volume Z-score - Sell trade count Z-score
Those differences, including Intensity Z-Score, are useful because they separate “more trades” from “larger trades.”
For directional flow context, see Net Taker Imbalance.
Absolute floors, relative triggers
Fixed absolute thresholds break when you scan many symbols with different baselines. That is why the core anomaly fields are z-score based: they normalize each symbol to its own behavior.
| Dimension | Absolute thresholds | Relative (z-score) thresholds |
|---|---|---|
| Example | Today Volume in $ > 1,000,000 | Buy volume Z-score (5m) > 2.5 |
| Cross-symbol portability | Poor: a BTC threshold is meaningless for a small-cap | Strong: each symbol normalized to its own history |
| Tuning | Needs re-tuning as volume regimes change | Less often: the baseline updates with each symbol’s recent history |
| Best use | Hard liquidity floors (Today Volume in $, Liquidity score 0-100) | Anomaly detection (volume, taker flow, concentration) |
Use absolute thresholds only for liquidity gates. Use relative thresholds for every anomaly signal. Relative vs Absolute Signals covers the same principle in more depth.
How do you layer crypto scanner filters?
Layer 1: Liquidity gate
Today Volume in $ > 500,000
AND Liquidity score 0-100 > 80
This avoids thin symbols where one order can distort everything. Kaiko’s liquidity concentration report (Kaiko Research, 2023) found that most altcoin order book depth sits in the top 10 altcoins. Further down the list, books thin out and short-window statistics break down.
Liquidity score 0-100 is the share of the last 1,440 minutes in which the symbol traded at least once. At 80, the market traded in roughly four of every five minutes; the product’s own presets use 85. Nearly every pair on BINANCE_PERPS scores close to 100, so on perps the gate rarely binds. It does its work on spot: on Coinbase, where most pairs trade less continuously, 80 filters out most of the list. Lower it deliberately if you scan Coinbase, and expect noisier 5m readings.
Layer 2: Primary signal
Choose one strong primary signal:
- Buy-side setup:
Buy volume Z-score (5m) > 2.5 - Sell-side setup:
Sell volume Z-score (5m) > 2.5
Layer 3: Directional confirmation
Net Taker Imbalance (5m) > 25or:
Taker Imbalance Z-Score (5m) > 2.0Raw imbalance gives current directional magnitude. The z-score tells you whether that imbalance is statistically unusual for this symbol.
Layer 4: Quality filter
Buy Volume Concentration (5m) > 1.5This is Buy Volume Concentration: it favors events where buy volume is growing faster than buy trade count, often a sign of larger participants.
Layer 5: Cross-timeframe confirmation
Buy volume Z-score (15m) > 1.5A lower threshold than the 5m. It filters out spikes that are only unusual on the short window, but it doesn’t prove the move persisted. The next section shows why.
Layer 6 (perps only): Open interest
On perpetuals, a buy-volume surge can mean two different things. If open interest rises at the same time, the buying is opening new positions. If it falls, the buying is at least partly shorts closing, by choice or through liquidation. The scanner can’t tell you what happens next in either case; the gate separates the two so you read them differently. Add:
OI Change % (60m) > 0.5Without it, a perp scanner treats new positioning and short covering as the same event. OI Change % exists on BINANCE_PERPS and HYPERLIQUID. On spot pairs the field is zero, so this condition also limits the rule to perps.
What does cross-timeframe confirmation filter out?
A 15m condition compares the event with the 15m baseline, so a burst that is only unusual at the 5m scale fails it. That removes a lot of short noise. It can’t prove persistence, because the 15m window contains the same minutes as the 5m.
The C-USDT perpetual breakout documented in Absorption vs Exhaustion in Order Flow: 3 Crypto Examples shows the difference. Deep Dive readings on March 24, 2026:
| UTC | Buy volume Z-score (5m) | Buy volume Z-score (15m) | Buy volume Z-score (60m) | Net Taker Imbalance (5m) |
|---|---|---|---|---|
| 11:19 | 2.69 | -0.15 | -0.87 | -6.2% |
| 11:20 | 134.86 | 31.17 | 7.38 | +34.3% |
| 11:23 | 76.39 | 17.54 | 3.81 | +28.5% |
| 11:24 | 1.26 | 17.98 | 4.00 | +2.8% |
At 11:20, every anomaly layer of the Aggressive Buy-Side Flow template below cleared: Buy volume Z-score (5m) 134.86, Net Taker Imbalance (5m) +34.3, Buy Volume Concentration (5m) 41.84, Buy volume Z-score (15m) 31.17, and Current Window Return (5m) +2.81%. One one-minute candle did all of it: a minute earlier, the 15m reading was -0.15. The Sell volume Z-score (5m) was 44.61 in the same minute, so both sides were extreme, with buyers dominant. The Deep Dive export doesn’t include Today Volume in $ or Liquidity score, so the liquidity layer can’t be checked from it.
The 11:24 row shows the other side of short windows. The spike minute rolled out of the 5m window, and the 5m reading fell from 76.39 to 1.26 in one step while the 15m stayed near 18.
To test persistence rather than size:
- On buy-side setups, add
NTI Positive Streak, the count of consecutive 1-minute bars where buy volume beat sell volume. - Or check the rule again after the 5m window has rolled past the trigger minute.
What followed the breakout is covered minute by minute in the examples post.
Three multi-timeframe scanner templates
1) Aggressive Buy-Side Flow
Today Volume in $ > 500,000
AND Liquidity score 0-100 > 80
AND Buy volume Z-score (5m) > 2.5
AND Net Taker Imbalance (5m) > 25
AND Buy Volume Concentration (5m) > 1.5
AND Buy volume Z-score (15m) > 1.5
AND Current Window Return (5m) > 0.2
Use this when you are hunting continuation candidates. Both flow and price have to respond together. Add NTI Positive Streak >= 5 if the buying should have lasted, not just spiked.
2) Sell-Side Distribution
Today Volume in $ > 500,000
AND Liquidity score 0-100 > 80
AND Sell volume Z-score (5m) > 2.5
AND Net Taker Imbalance (5m) < -20
AND Sell Volume Concentration (5m) > 1.5
AND Sell volume Z-score (15m) > 1.5
This one requires sell-side flow to be unusual on both the 5m and the 15m. One extreme minute can still clear both, so check the Deep Dive before reading it as sustained distribution.
3) Cross-Timeframe Directional Anomaly
Today Volume in $ > 1,000,000
AND Taker Imbalance Z-Score (5m) > 2.5
AND Taker Imbalance Z-Score (15m) > 1.5
AND Net Taker Imbalance (5m) > 15
AND Trend Cleanliness (15m) > 60
AND Buy volume Z-score (60m) > 1.0
Reach for this when the imbalance has to stay unusual even as the window stretches out. The 15m Trend Cleanliness condition (the candle body as a share of the window’s high-low range, 0-100) filters out choppy, direction-switching windows that can still post high imbalance z-scores.
What should you tune first?
Tune in this order:
- Today Volume in $ floor (noise control).
- 5m z-score threshold (signal sensitivity).
- 15m confirmation threshold (false positive reduction).
- Concentration threshold (Buy Volume Concentration or Sell Volume Concentration) for trade-quality control.
This order comes from testing the obvious shortcuts first: tightening the 5m z-score before the liquidity floor, tuning concentration ahead of confirmation. Each variant produced rules that looked cleaner in the editor and fired worse in live markets.
Common failure pattern: lowering the 5m threshold too early. That increases alert count but usually destroys precision.
If your rule is too strict, lower confirmation thresholds before removing the liquidity gate.
One portability note: absolute Current Window Return thresholds (e.g. > 0.2) behave differently across symbols with different baseline volatility. A 0.2% move is noise on BTC but a real event on a quiet stablecoin pair. For cross-symbol scanners, read the return against the window’s range: pair the sign from Current Window Return (5m) > 0 with Trend Cleanliness, the body’s share of the range on a 0-100 scale.
If the rule is meant to find coin-specific movement rather than broad market beta, add a correlation layer. The BTC Correlation Scanner shows how to compare 1H and 24H correlation so the scanner can separate an altcoin breaking away from Bitcoin from a normal BTC-led move.
What’s the final checklist before saving a scanner?
- Keep at least one liquidity condition: Today Volume in $ or Liquidity score 0-100 (the score runs 0-100, not 0-1; nearly every Binance perp sits close to 100)
- Use one primary signal + one directional signal
- Add at least one 15m confirmation condition, and a persistence check if the rule should catch sustained flow
- For perp rules (
BINANCE_PERPS,HYPERLIQUID), include an open-interest gate (OI Change % (60m) > 0.5) to separate new positioning from short covering - Avoid rules that rely on a single metric only
- Re-check performance after major volatility regime changes
A good scanner fires for the same market behavior every time. That is the only bar that matters.
If you want to see how these metrics combine in a live order-flow context, read Crypto Order Flow Trading: Taker Flow and Scanner Rules and Order Flow Absorption vs. Exhaustion, then apply one of the templates above in your own scanner.
On the free tier, these rules run on 30-minute delayed data with up to 2 scanners. Real-time alerts and Telegram or NTFY delivery are on the paid plan.
Open AnomIQ and build your first multi-timeframe scanner.
FAQ
What threshold should I start with for Buy volume Z-score?
Start with Buy volume Z-score (5m) > 2.5, then tighten or loosen based on alert volume and quality. Use 15m confirmation before lowering 5m thresholds.
Should I use Net Taker Imbalance or Taker Imbalance Z-Score?
Use both when possible. Net Taker Imbalance gives immediate directional magnitude. Taker Imbalance Z-Score tells you whether that reading is unusual for this symbol.
Why keep a liquidity gate if z-scores are relative?
Relative metrics still fail on thin markets where one participant can distort the window. Today Volume in $ and Liquidity score 0-100 reduce this failure mode. Liquidity score is the share of the last 1,440 minutes with at least one trade. Nearly every Binance perp scores close to 100, so the gate mainly excludes thin spot pairs.
How many conditions should one scanner rule have?
For this setup, 5 to 8 conditions is enough: liquidity gate, primary anomaly, directional confirmation, one quality filter, and one cross-timeframe condition.
How often should I retune thresholds?
Retune after clear volatility regime shifts or when alert precision changes materially. Do not retune daily; that usually leads to overfitting.
Why does a 5m z-score drop to near zero a few minutes after a spike?
The spike minute has left the window. The 5m window holds four completed 1-minute bars plus the one forming, so an extreme minute stays in it for about five minutes, then rolls out. In the C-USDT breakout on March 24, 2026, the 5m Buy volume Z-score fell from 76.39 to 1.26 in one step while the 15m stayed near 18. After a large candle, watch the 15m and 60m.