
Previous-Day Volume Profile Scanner for Crypto Markets

Trader turned software engineer, with 4+ years building systems for crypto exchanges. Founder of AnomIQ, a real-time crypto anomaly scanner for quantitative traders.
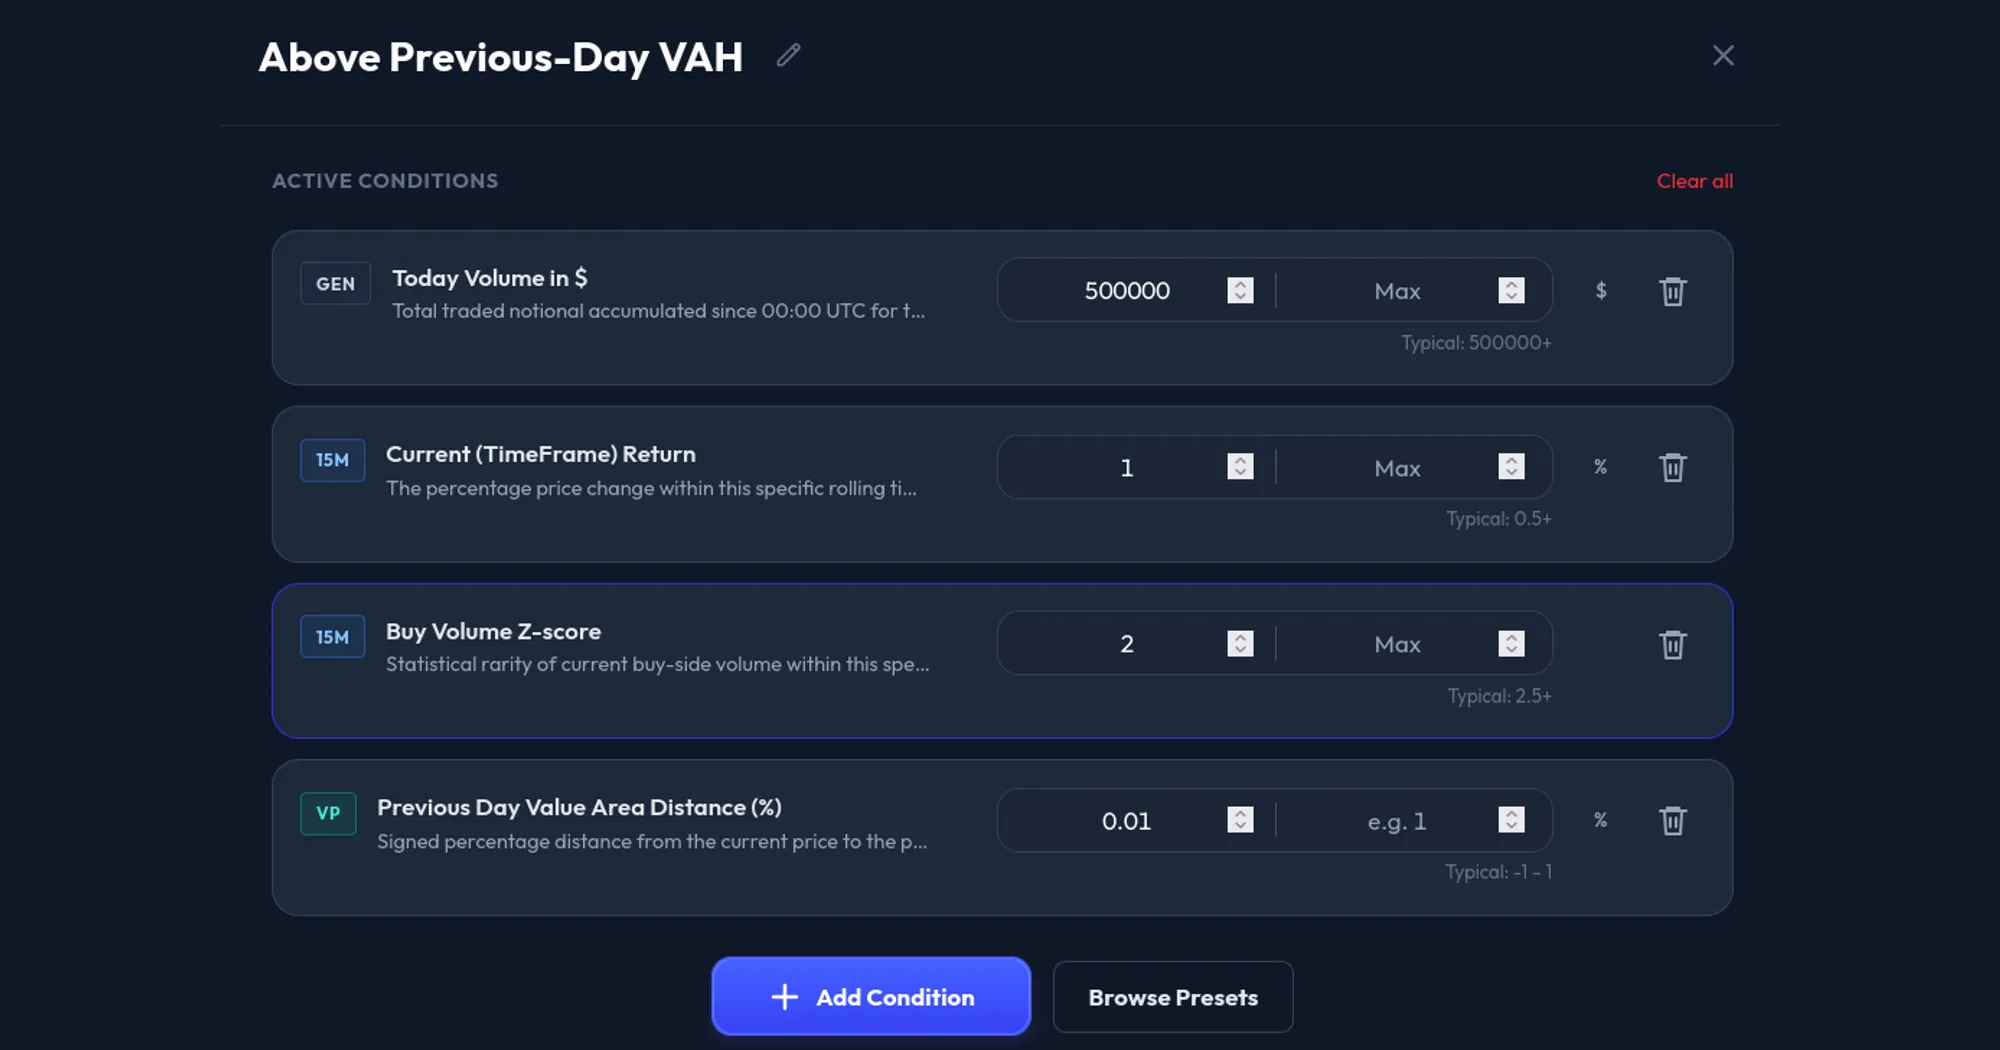
A previous-day Volume Profile scanner filters markets by where current price sits relative to fixed prior-session volume levels: Point of Control, High Volume Nodes, Low Volume Nodes, Value Area High, and Value Area Low.
In AnomIQ, those levels come from the previous complete UTC day. The live scanner then checks current volume, taker imbalance, price movement, open interest, and liquidity around those fixed areas.
You do not need to open hundreds of charts just to see which coins are near yesterday’s profile levels.
The scanner separates the job into two layers:
Previous-day Volume Profile = fixed market structure
Live anomaly filters = current activity around that structure
You can ask tighter questions:
- Which coins are trading near yesterday’s Point of Control?
- Which coins are inside yesterday’s Value Area?
- Which coins are breaking above previous-day VAH?
- Which coins are approaching a previous-day High Volume Node?
- Which coins are moving through a previous-day Low Volume Node with abnormal volume?
Key Takeaways
- Previous-day Volume Profile levels (POC, HVN, LVN, VAH, VAL) come from the last complete UTC day and stay fixed all session; live filters measure what is happening around them now.
- Every level has a signed filter (negative below, 0 inside, positive above) and an Abs filter that measures proximity only.
- The value area holds 70% of the prior day’s volume. HVNs are zones where every bucket traded at least half the POC’s volume; LVNs are thin valleys (35% of POC volume or less) between heavier areas.
- Use the profile for location and a live metric (Total Volume Z-score, Net Taker Imbalance, Current Return) for activity. Neither is a trade signal on its own.
Volume Profile Filters Available in AnomIQ
| Filter | What it measures | Example use |
|---|---|---|
| Previous Day POC Distance (%) | Signed distance from yesterday’s POC bucket | Separate coins above POC from coins below POC |
| Previous Day POC Distance Abs (%) | Absolute distance from yesterday’s POC bucket | Find coins near the prior high-volume area |
| Previous Day Value Area Distance (%) | Signed distance from yesterday’s value area | Scan above VAH, below VAL, or inside value |
| Previous Day Value Area Distance Abs (%) | Absolute distance from yesterday’s value area | Find coins close to VAH, VAL, or inside value |
| Nearest Previous Day HVN Distance (%) | Signed distance from the closest previous-day High Volume Node | Separate price above HVN from price below HVN |
| Nearest Previous Day HVN Distance Abs (%) | Absolute distance from the closest previous-day HVN | Find coins near prior acceptance zones |
| Nearest Previous Day LVN Distance (%) | Signed distance from the closest previous-day Low Volume Node | Separate price above LVN from price below LVN |
| Nearest Previous Day LVN Distance Abs (%) | Absolute distance from the closest previous-day LVN | Find coins entering thin prior-session areas |
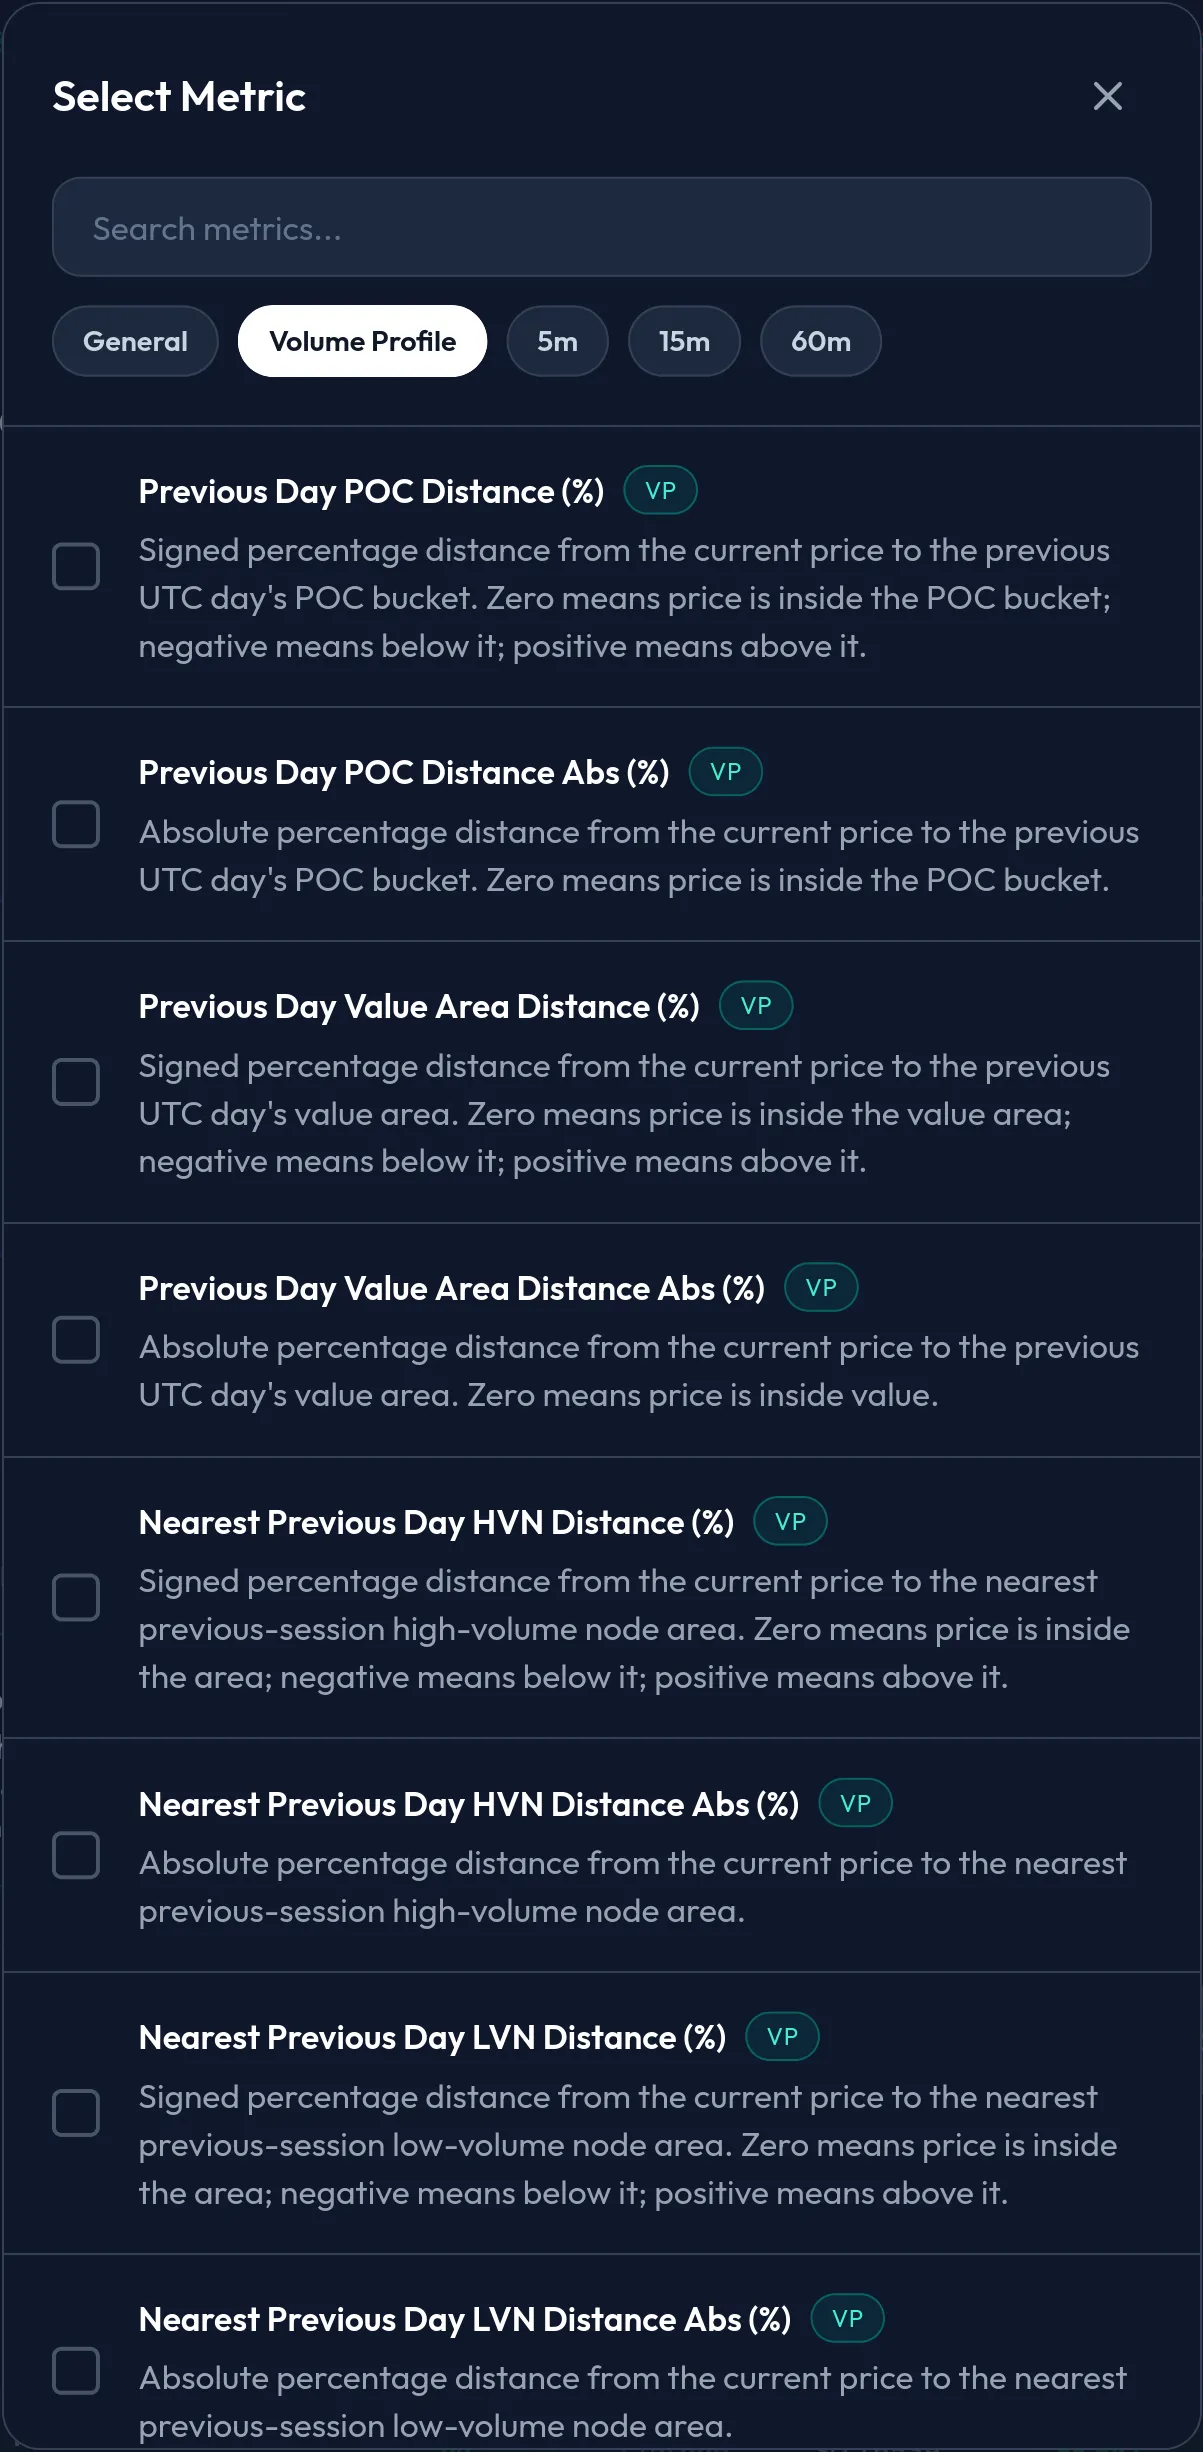
The Volume Profile tab in the scanner’s metric picker. Each level comes in a signed version (negative below, 0 inside, positive above) and an Abs version that measures proximity only.
Common confirmation filters: Today Volume in $, Total Volume Z-score, Buy Volume Z-score, Net Taker Imbalance, and BTC Correlation. For the broader order-flow framework behind those confirmations, see Crypto Order Flow Trading: Taker Flow and Scanner Rules. For correlation-specific scanner logic, use the BTC Correlation Scanner.
For a live BTC example of the same levels outside the scanner, use the Bitcoin Volume Profile POC Current tool. It shows developing POC, previous-day POC, VWAP, VAH, VAL, HVN and LVN distance from current price. Read the Bitcoin Volume Profile levels guide for a label-by-label explanation of the live panel.
Why This Is a Scanner Feature, Not Just a Chart Tool
Most traders use Volume Profile manually. Open one chart, draw the profile, mark POC, VAH, VAL, HVNs and LVNs, then watch price react.
That works if you trade three symbols. It breaks if you want to monitor hundreds.
A scanner needs profile context as data. SOL being up 2% or trading elevated volume is incomplete without location. The scanner also needs to know whether SOL is trading:
- inside yesterday’s accepted range
- above yesterday’s Value Area High
- below yesterday’s Value Area Low
- near yesterday’s highest-volume bucket
- near a previous high-volume acceptance area
- inside a previous low-volume pocket
The Volume Profile section turns those conditions into filters.
The scanner still updates in real time. Current price, volume, trade imbalance, open interest and timeframe metrics keep moving. The profile levels stay fixed because they come from the previous completed session.
If a scanner result says a coin is near previous-day POC, that reference level is the same at 09:00, 12:00 and 18:00 UTC. Only current price and current flow change around it.
Why AnomIQ Uses the Previous Complete UTC Day
Live Volume Profile can help on a chart. It is weaker as a scanner filter.
The current session’s POC can shift as new trades arrive. Value Area High and Value Area Low can expand. A high-volume node can appear early, then become less relevant after more volume trades elsewhere. If a scanner rule depends on moving profile levels, the meaning of that rule changes throughout the day.
Previous-day profile is different:
- The session is complete.
- Every trade from that UTC day has been counted.
- POC, HVN, LVN, VAH and VAL are fixed for the current day.
- Scanner results compare cleanly across coins.
- Alerts keep the same meaning throughout the day.
The profile answers “where is price relative to yesterday’s traded volume structure?” The live scanner answers “is something unusual happening there right now?” Keep those two questions separate. Mixing them makes scanner rules harder to read.
Volume profile is one way to anchor to yesterday. The simpler one is price: the previous day’s high and low. The PDH/PDL bounce strategy covers trading those extremes, and why the UTC day boundary matters there too.
Adaptive Buckets: Why BTC and a Low-Priced Coin Need Different Profiles
Volume Profile is built from price buckets. Each trade is assigned to a bucket, and the bucket accumulates volume.
A fixed bucket size would fail across crypto markets.
A $5 bucket may be reasonable for BTC. The same $5 bucket on a $0.40 coin would be too wide. A $0.001 bucket may work for a low-priced coin, but it would create too many tiny buckets on BTC.
AnomIQ sizes buckets per symbol from that symbol’s own price range. At each UTC day boundary it takes the previous complete day’s high-to-low range in ticks, divides it by 24, rounds to a clean tick step (10, 20, 30, 50, 80, 100 ticks, and so on), and clamps the result between 25 and 20,000 ticks. The POC scanner guide walks through that calculation step by step, and the crypto volume profile guide applies it to real September 30, 2026 ranges for BTC, ETH and two low-priced perpetuals.
Bucket behavior changes by market:
| Market type | Bucket behavior |
|---|---|
| BTC or ETH | Wider dollar buckets, because their daily range in dollars is large |
| Mid-cap altcoin | Medium buckets scaled to its own daily range |
| Low-priced coin | Smaller dollar buckets scaled to its own daily range, subject to the 25-tick minimum |
Liquidity does not enter the formula; price range and tick size do. That is what lets the scanner compare symbols with very different price scales: BTC, ETH and a low-priced altcoin cannot share one raw dollar bucket size without distorting the profile.
Point of Control: Find Coins Near Yesterday’s Highest-Volume Area
The Point of Control, or POC, is the previous-day price bucket where the most volume traded. It is the highest-volume part of the prior session’s profile, not a live prediction and not an exact single trade price. It shows where the previous session did the most two-sided business, which makes it useful location context and nothing more on its own.
POC distance filters:
Previous Day POC Distance (%)
Previous Day POC Distance Abs (%)
The signed distance gives direction:
negative = current price is below previous-day POC
zero     = current price is inside the POC bucket
positive = current price is above previous-day POC
The absolute distance ignores direction and only measures closeness.
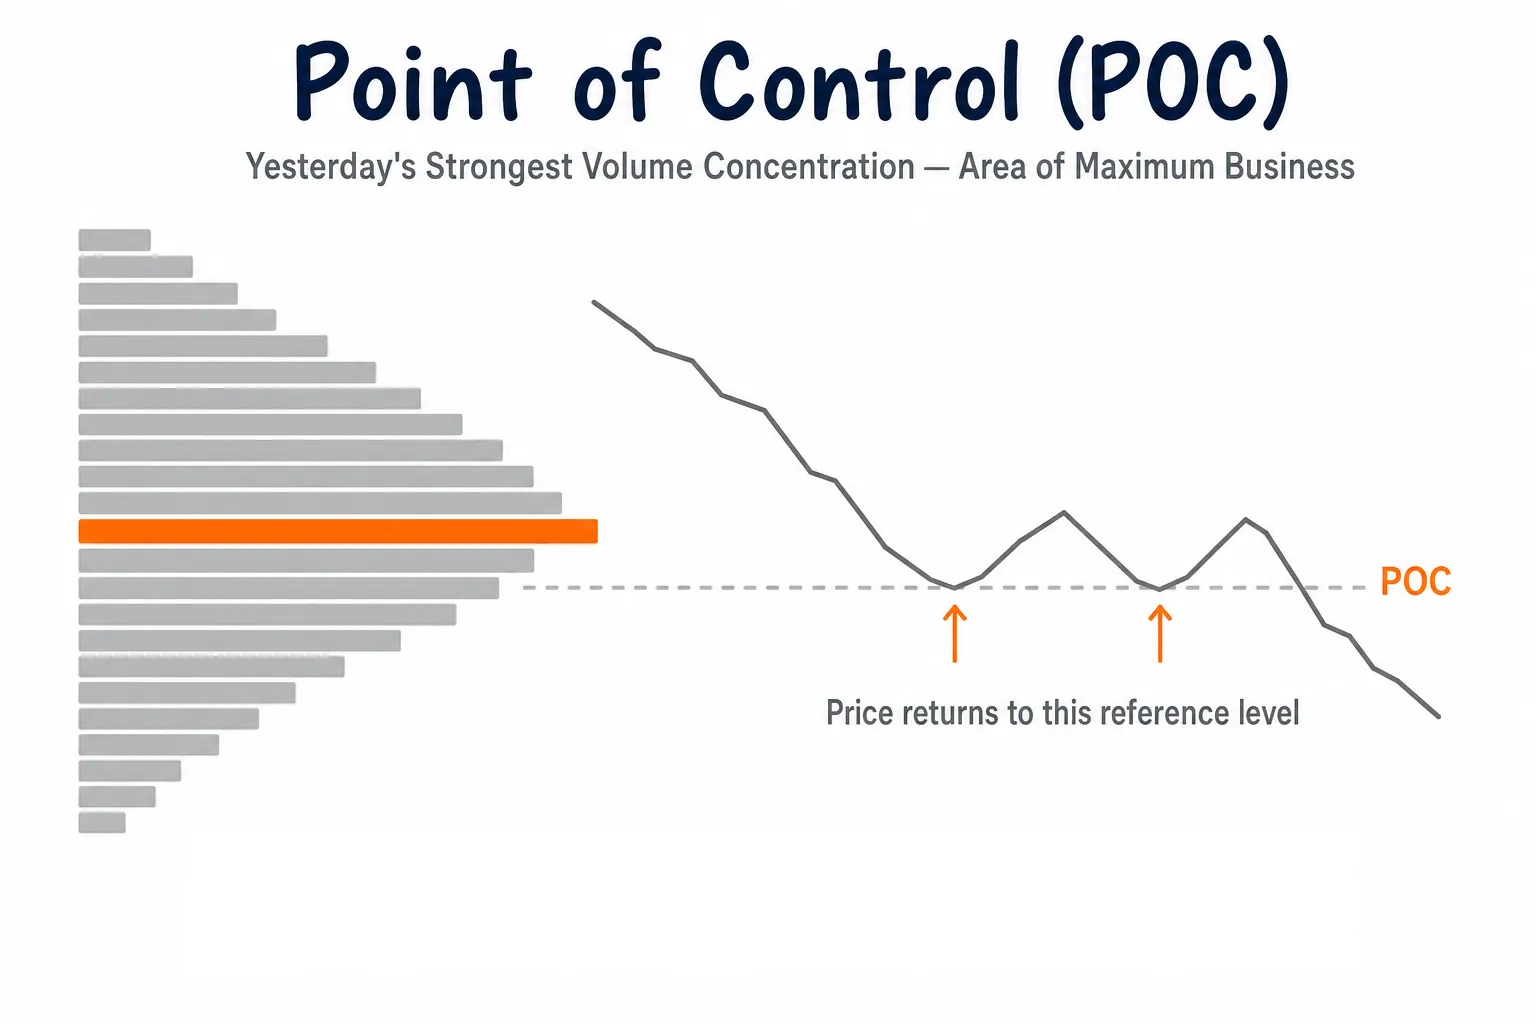
POC marks the previous-day price bucket with the highest traded volume. Signed distance tells whether price is above or below it; absolute distance tells how close price is.
Example scanner:
Previous Day POC Distance Abs (%) <= 0.30
AND Total Volume Z-score (5m) >= 2.0
Use this to surface coins close to yesterday’s highest-volume area while 5-minute volume is elevated relative to the coin’s own history.
A stricter version can add liquidity:
Today Volume in $ > 500000
AND Previous Day POC Distance Abs (%) <= 0.30
AND Net Taker Imbalance (5m) >= 20
The liquidity floor removes thin symbols. The taker imbalance condition requires current flow to lean in one direction.
For the full POC explanation, including the bucket math, see POC Scanner: Alerts When Crypto Returns to Yesterday’s Point of Control.
High Volume Nodes: Find Coins Near Previous Acceptance Areas
A High Volume Node, or HVN, is a previous-day price zone where volume clustered. Instead of one exact level, an HVN is a run of neighboring buckets that all traded heavily compared with the rest of the profile.
AnomIQ uses a fixed rule: an HVN is a run of adjacent buckets where every bucket traded at least 50% of the POC bucket’s volume. Up to five HVN zones are kept per day, largest first. The POC bucket always clears that 50% bar, so in practice the POC sits inside an HVN zone as its peak rather than apart from it. A single previous day can have several HVNs because volume can cluster in separate zones.
Think of an HVN as a prior acceptance area: price spent enough traded volume there for the area to stand out in the completed session. It does not mean the area must act as support or resistance. It means the market previously found enough liquidity and participation there to build a visible volume cluster.
The scanner uses the nearest previous-day HVN because there can be multiple nodes in the same profile. The interesting question is what live activity is doing now around that location.
Nearest-HVN filters:
Nearest Previous Day HVN Distance (%)
Nearest Previous Day HVN Distance Abs (%)
Use the signed field when side matters, and the absolute field when you only care about proximity:
negative = current price is below nearest previous-day HVN
zero     = current price is inside nearest previous-day HVN
positive = current price is above nearest previous-day HVN
Example scanner:
Nearest Previous Day HVN Distance Abs (%) <= 0.30
AND Buy Volume Z-score (15m) >= 2.0
AND Today Volume in $ > 500000
Use this to find liquid coins near a previous-day acceptance area while buy-side volume is elevated. The HVN is the location. The live filter tells you whether current activity around that location is unusual.
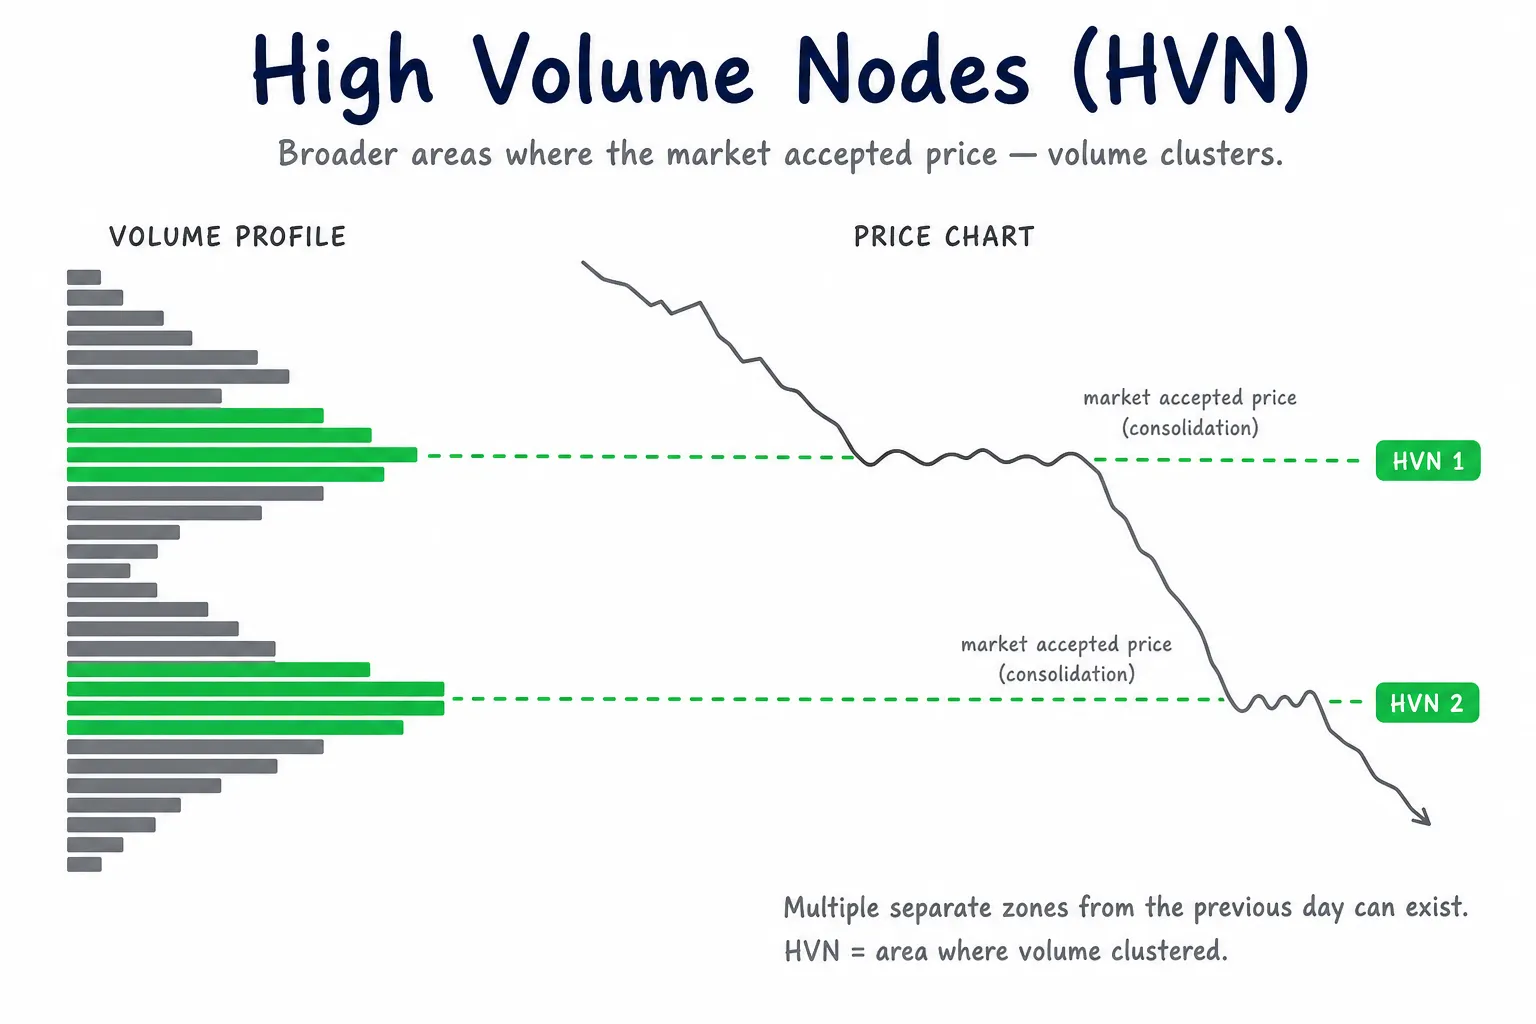
HVNs mark prior areas where volume clustered. The scanner measures distance to the nearest HVN, because a profile can contain several high-volume zones.
Low Volume Nodes: Find Coins Moving Through Thin Previous-Day Areas
A Low Volume Node, or LVN, is a previous-day price zone where relatively little volume traded: a thin valley in the profile between heavier volume clusters.
AnomIQ’s rule: an LVN is a run of buckets that each traded 35% or less of the POC bucket’s volume, with a bucket of at least 50% of POC volume somewhere above it and somewhere below it. That second condition is what makes it a valley rather than the thin tail at the edge of the day’s range. Up to five LVN zones are kept per day, thinnest first. These are areas where price moved quickly or where the market did not spend much time accepting price.
An LVN does not automatically mean price will break through or reject. When current price approaches an LVN, the scanner is telling you that price is near a thin prior-session zone, not that a trade should be taken. Paired with elevated volume, a clean current move, or strong taker imbalance, it can surface coins where price is interacting with a low-acceptance area.
Nearest-LVN filters:
Nearest Previous Day LVN Distance (%)
Nearest Previous Day LVN Distance Abs (%)
Signed distance works like this:
negative = current price is below nearest previous-day LVN
zero     = current price is inside nearest previous-day LVN
positive = current price is above nearest previous-day LVN
Example scanner:
Nearest Previous Day LVN Distance Abs (%) <= 0.30
AND Current (TimeFrame) Return (5m) >= 0.50
AND Total Volume Z-score (5m) >= 2.0
Use this to catch coins approaching or trading inside a thin previous-day area while current movement and volume are elevated. Then check on the chart whether price moves through the area cleanly, rejects from it, or fails to hold it.
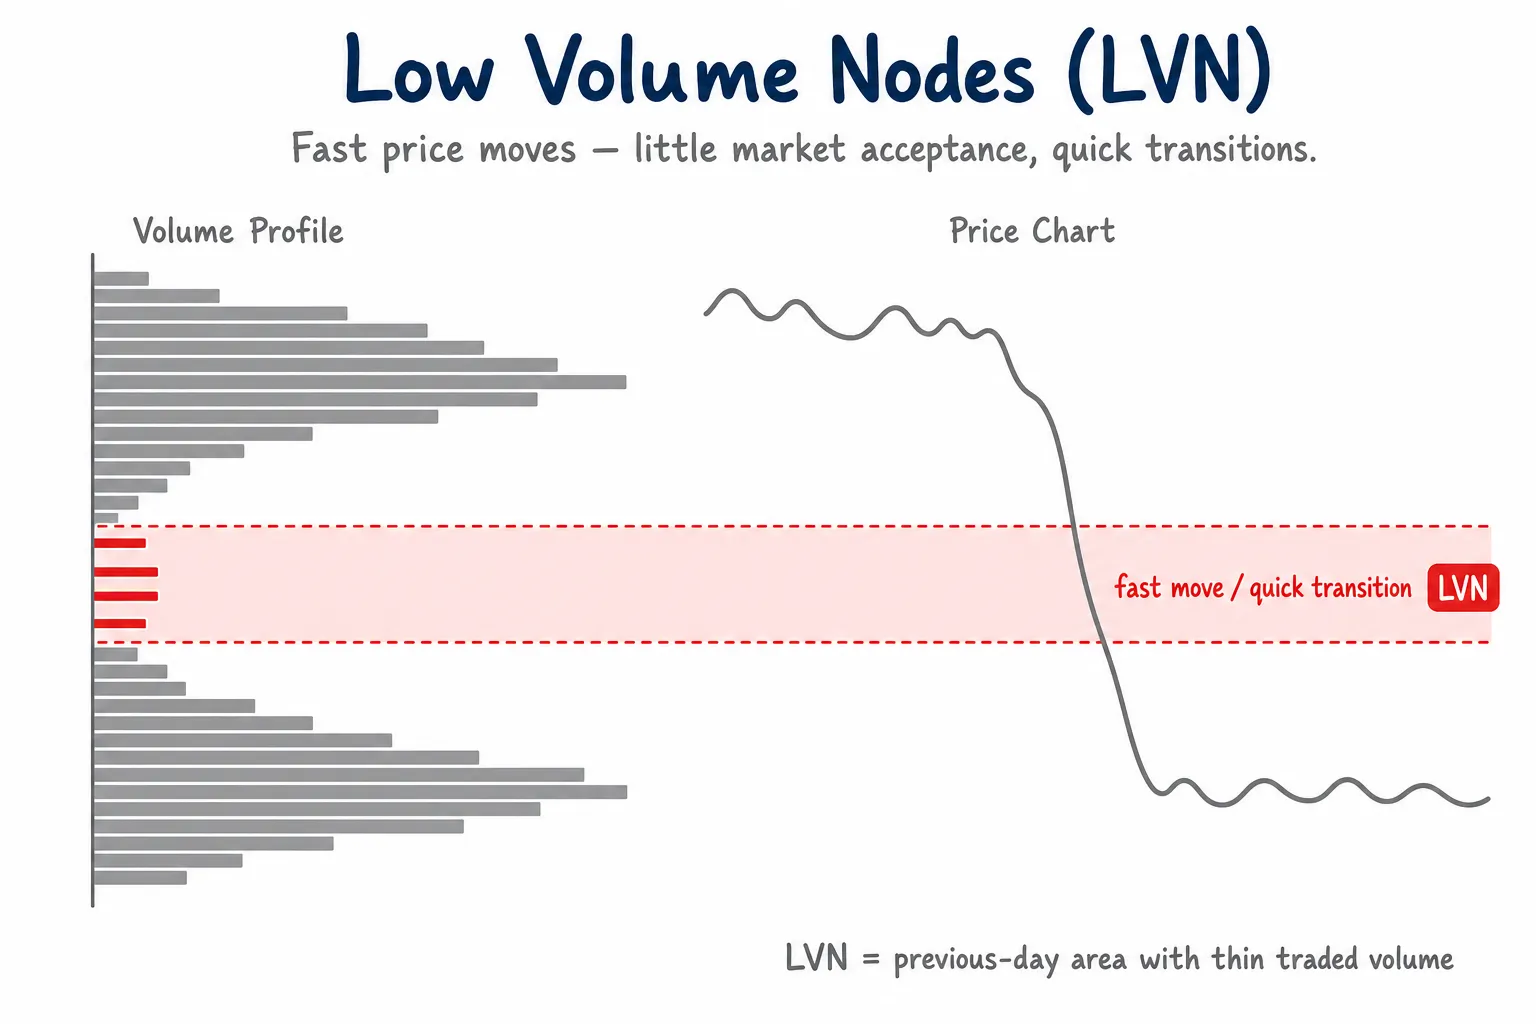
LVNs mark thinner prior-session areas. Use LVN distance as location context, then confirm with live movement, volume, or imbalance.
Value Area: Filter Coins Above VAH, Below VAL or Inside Value
The Value Area is the previous-day price range around the POC that holds 70% of the session’s traded volume. It summarizes where most of the prior session’s business occurred, instead of focusing on one single bucket.
In Volume Profile and Market Profile usage, the value area is the session’s central accepted range, and 70% is the conventional share. In AnomIQ, it is calculated from the completed previous UTC day and then kept fixed for the current session, so the scanner compares live price against a stable reference, not a moving intraday level.
Value Area is bounded by VAL (Value Area Low) and VAH (Value Area High). Price inside value means the coin is trading within yesterday’s accepted range. Price above VAH means it is trading above that range; price below VAL means it is trading below it.
Value-area fields:
Previous Day Value Area Distance (%)
Previous Day Value Area Distance Abs (%)
Signed distance carries the below, inside, and above states without a separate position field:
negative = current price is below previous-day VAL
zero     = current price is inside previous-day value area
positive = current price is above previous-day VAH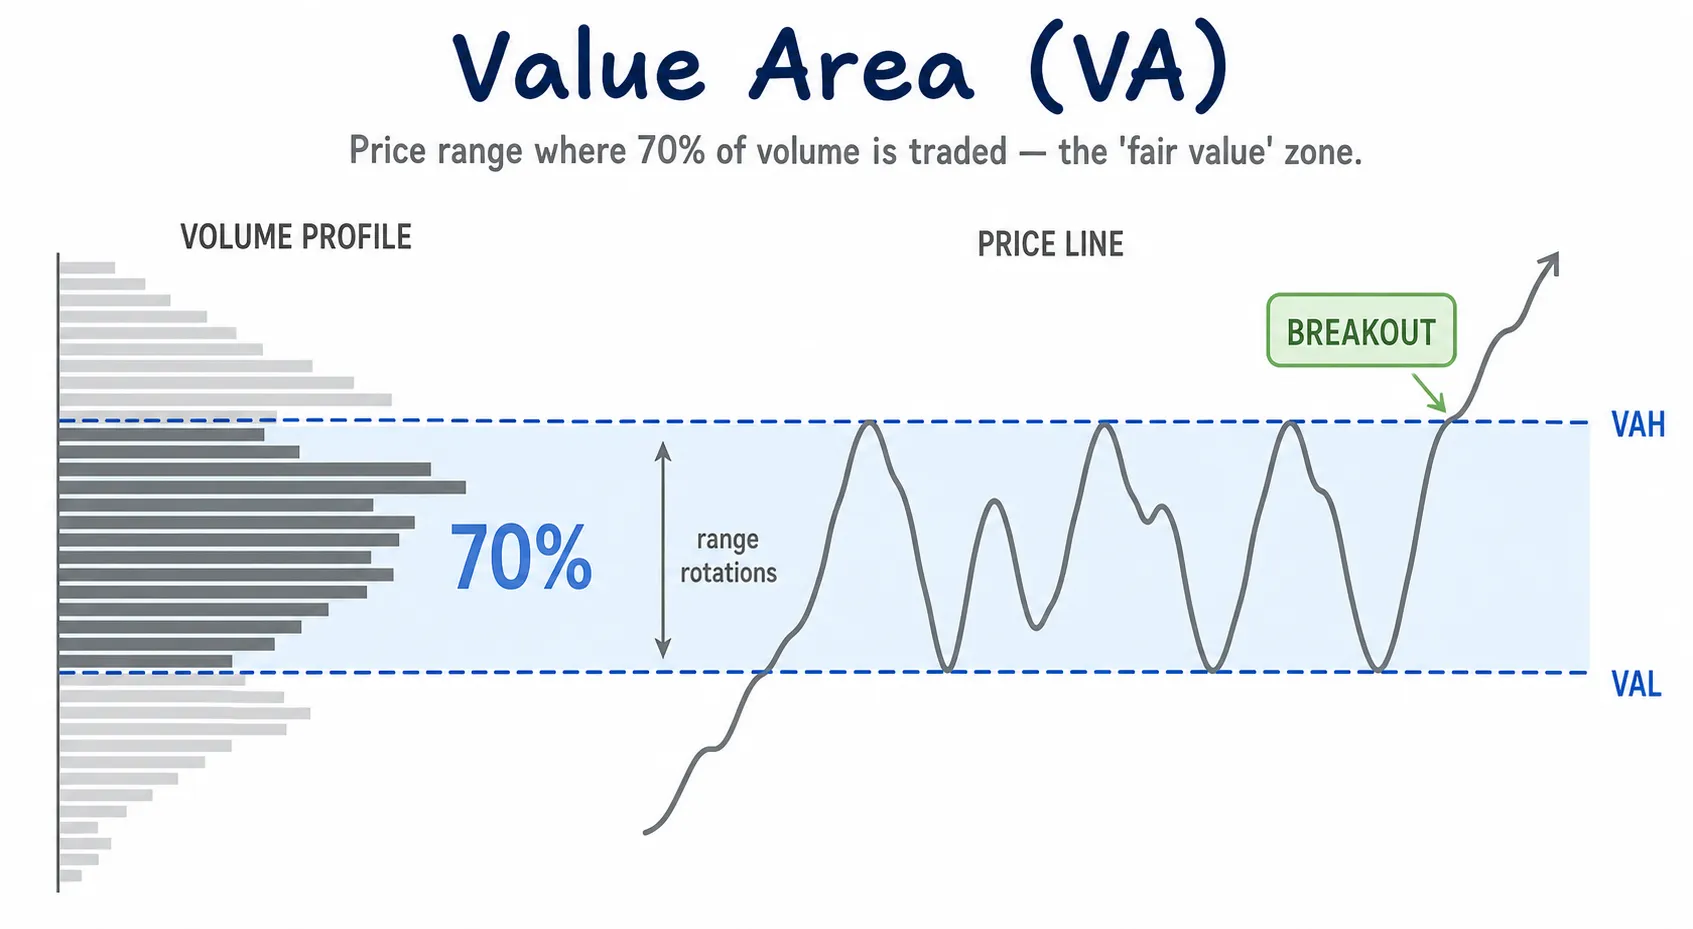
Value Area is the previous-day accepted range. Signed distance shows below VAL, inside value, or above VAH; absolute distance measures closeness to value.
You can build scanner rules around VAH and VAL without drawing the profile on every chart.
Inside or very close to previous-day value:
Previous Day Value Area Distance Abs (%) <= 0.25Above previous-day VAH:
Previous Day Value Area Distance (%) >= 0.01Below previous-day VAL:
Previous Day Value Area Distance (%) <= -0.01Why 0.01 and not 0: the scanner’s min and max boxes are inclusive, and every coin inside the value area reads exactly 0. A min of 0 would return everything inside value as well as everything above VAH. A tiny offset keeps “inside” out.
Example continuation scanner:
Today Volume in $ > 500000
AND Previous Day Value Area Distance (%) >= 0.01
AND Current (TimeFrame) Return (15m) >= 1.0
AND Buy Volume Z-score (15m) >= 2.0
Use this to find liquid coins trading above yesterday’s accepted range with elevated buy-side volume.
Example return-to-value scanner:
Today Volume in $ > 500000
AND Previous Day Value Area Distance (%) <= -0.01
AND Sell Volume Z-score (5m) <= 0.5
AND Current (TimeFrame) Return (5m) >= 0.30
Use this to find coins below yesterday’s accepted range where sell-side volume is no longer elevated and price starts moving back toward value.
For more on combining scanner fields across categories and timeframes, see Custom Crypto Scanner Filters: How to Combine General, 5m, 15m and 60m Conditions.
How to Use Previous-Day Volume Profile Filters
Volume Profile filters are location filters. Build a rule in four steps:
- Choose one profile location filter: near POC, near HVN, near LVN, inside value, above VAH, or below VAL.
- Add a liquidity floor such as Today Volume in $ so thin symbols do not dominate results.
- Add one live activity filter such as Total Volume Z-score, Buy Volume Z-score, Net Taker Imbalance, Current Return, Intensity Z-Score, or OI Change %.
- Review the matching coin on the chart to decide whether price is accepting, rejecting, or moving through the previous-day profile area.
A clean setup has three layers:
| Layer | Example |
|---|---|
| Liquidity floor | Today Volume in $ > 500000 |
| Profile location | Previous Day POC Distance Abs (%) <= 0.30 |
| Live confirmation | Total Volume Z-score (5m) >= 2.0 |
Other combinations:
Above previous-day VAH
+ Buy Volume Z-score (15m) >= 2.0
+ BTC Correlation 1H <= 0.45
Price is above yesterday’s accepted range, buy-side volume is elevated, and the coin is moving more independently from BTC.
Near previous-day LVN
+ Current (TimeFrame) Return (5m) >= 0.50
+ Intensity Z-Score (Volume vs Count) (5m) >= 2.0
Price is near a thin previous-day area and volume is rising unusually fast relative to trade count, meaning the average execution is getting larger.
Inside previous-day HVN
+ Net Taker Imbalance (5m) <= -20
Price is inside a previous acceptance area while aggressive selling shows up in taker flow.
Chart review still matters. The scanner cuts the search space: instead of checking hundreds of charts for profile levels, it surfaces the coins already interacting with previous-day structure. For BTC specifically, the Bitcoin Volume Profile POC Current tool gives you a live reference page before you convert the same logic into scanner filters.
Frequently Asked Questions
What is a previous-day Volume Profile scanner?
A previous-day Volume Profile scanner filters markets by where current price sits relative to fixed prior-session volume levels: Point of Control, High Volume Nodes, Low Volume Nodes, Value Area High and Value Area Low. In AnomIQ, those levels come from the previous complete UTC day, while live scanner filters measure current volume, taker imbalance and price movement around them.
Are the Volume Profile levels live or previous-day levels?
The profile levels come from the previous complete UTC day. The scanner evaluates current price against those fixed levels in real time. This keeps POC, HVN, LVN, VAH and VAL stable during the current session while live anomaly metrics measure current activity.
Why use previous-day Volume Profile instead of live in-progress Volume Profile?
Live Volume Profile levels move as new trades arrive. Previous-day levels are finished. POC, HVN, LVN, VAH and VAL stay fixed for the current session, so a scanner match at 09:00 UTC means the same thing as a match at 18:00 UTC.
Which Volume Profile filters can I use?
The scanner can filter by signed and absolute distance to previous-day POC, previous-day Value Area, nearest previous-day HVN, and nearest previous-day LVN.
How are Volume Profile buckets sized across different crypto markets?
AnomIQ takes each symbol’s previous complete UTC day range, converts it to ticks, divides by 24, rounds to a clean tick step, and clamps the result to between 25 and 20,000 ticks. BTC and a low-priced altcoin therefore get different dollar bucket widths, each scaled to its own daily range.
What the Scanner Adds
The scanner already flags abnormal current activity: unusual volume, trade count, taker imbalance, price movement, open interest changes and correlation shifts. The Volume Profile section attaches location to it.
Not just: this coin has unusual volume.
But: this coin has unusual volume near yesterday's POC.
The profile levels come from the previous whole day, and results surface when current price and current activity line up with those fixed areas: fewer raw activity alerts, more context about where the activity is happening.