
What Is a Liquidity Sweep? Crypto Examples and Order Flow

Trader turned software engineer, with 4+ years building systems for crypto exchanges. Founder of AnomIQ, a real-time crypto anomaly scanner for quantitative traders.
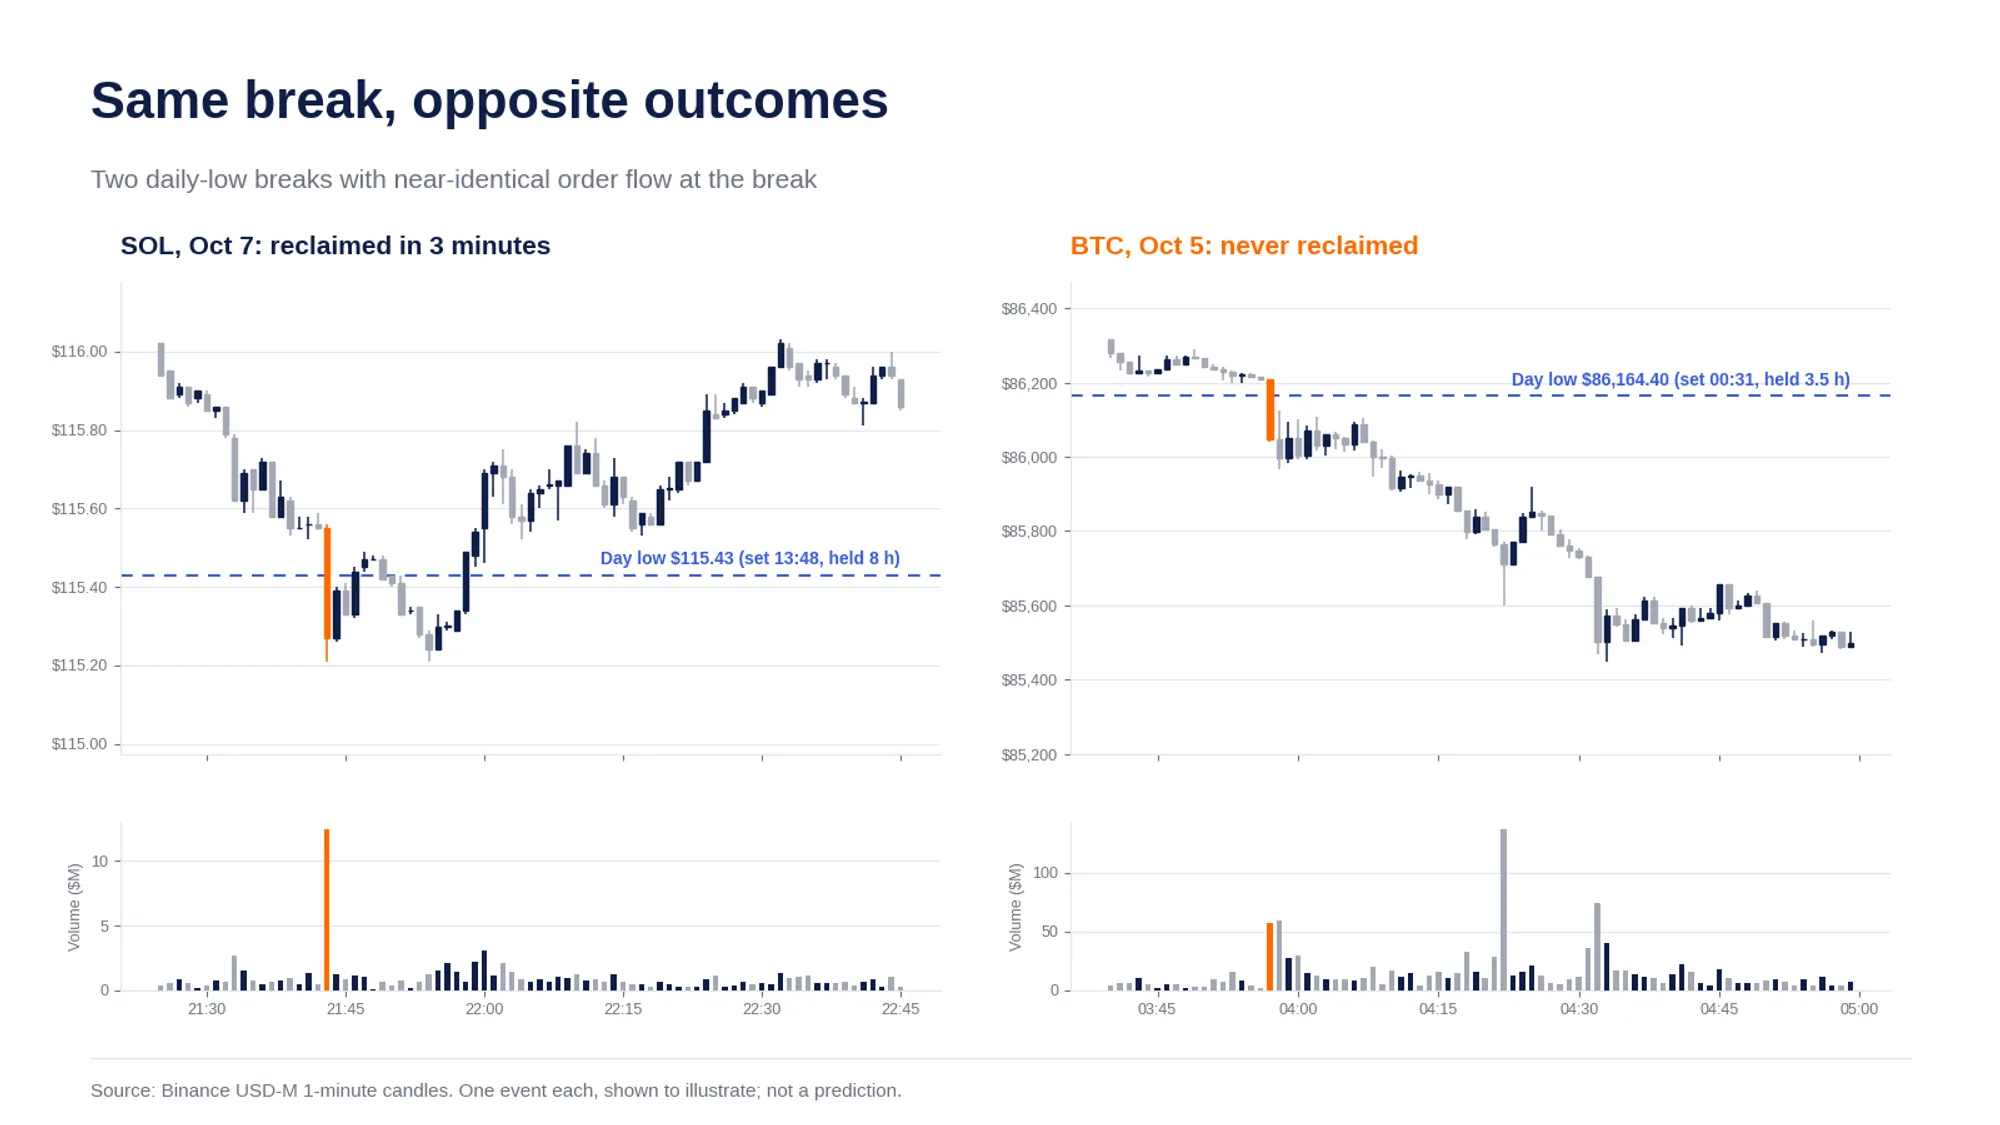
A liquidity sweep is a fast move through a price level where stop orders cluster, usually a prior high or low, that triggers those stops and then returns back inside the level. As price passes through the level, the stops turn into market orders. When that burst gets absorbed, price reclaims the level, and the move looks like a trap on the chart.
Every liquidity sweep example you’ve seen was labeled after the fact. Price came back, so the dip got the name. What a trader wants to know is harder: can you tell a sweep from a real breakdown while it’s still happening?
I tested it. Across 9,798 breaks of a daily low on crypto perpetual futures, over three weeks of AnomIQ data from Binance and Hyperliquid, the eventual sweeps and the eventual breakdowns looked the same at the moment of the break. I went in expecting at least one order-flow reading to give the outcome away. None did.
The rest of this post covers where liquidity sits, the vocabulary, the full results (including two of my own hypotheses that failed), a matched pair of real examples, and a scanner filter for catching reclaims as they happen.
Key Takeaways
- A liquidity sweep runs the stop orders beyond an obvious high or low and returns inside the level; a breakdown runs them and keeps going.
- In 9,798 day-low breaks on Binance and Hyperliquid perpetuals (September 18 to October 8, 2026), 38.9% reclaimed and held, 18.3% broke down and 42.8% did neither.
- At the break, taker flow, price impact and open interest didn’t separate sweeps from breakdowns: every measure scored between 0.44 and 0.54 on a scale where 0.5 is a coin flip.
- Two popular rules failed our pre-registered test: market-wide drops reclaimed more often than coin-specific ones (45.9% vs 37.5%), and a day low sitting on yesterday’s POC or value area made no measurable difference.
- The usable signal is the reclaim itself. Fifteen minutes after the break, median 5m taker imbalance was +5.5 for sweeps and -9.8 for breakdowns.
What Is a Liquidity Sweep?
Start with the level. It’s usually something obvious: the day’s low, yesterday’s high, a swing point, a round number. The “liquidity” is the pile of resting orders sitting just beyond it.
Traders who bought near a support level put their stop-losses a little below it. A stop-loss is a sell order waiting for a trigger price.
When price trades through, those orders fire together as market sells, so a sudden wave ofaggressive selling hits the book. If passive buyers absorb it, the wave runs out, and price climbs back above the level within minutes. The stops were swept. If the selling keeps finding no support, the level breaks for real.
Buy-side and sell-side liquidity
Sell-side liquidity sits below lows. It’s mostly long holders’ stop-losses plus breakout traders’ sell orders. A sweep of sell-side liquidity is the dip below a low that comes back.
Buy-side liquidity sits above highs. It’s mostly short sellers’ stop-losses plus breakout buy orders. A sweep of buy-side liquidity is the poke above a high that fails.
This article works through the sell-side case, a sweep of a daily low, because that’s what I measured. Everything mirrors for highs.
Why stops cluster at obvious levels
Stops cluster where everyone can see the same line. Economists have measured what happens when they fire: in a Federal Reserve Bank of New York staff report, Carol Osler found evidence that stop-loss orders contribute to rapid, self-reinforcing price movements, which she called “price cascades.” Her data came from currency markets, but the mechanism carries over: a cluster of stops is a cluster of market orders waiting for a trigger.
Most liquidity sweep guides go further and name a culprit: “institutions” or “smart money” hunting retail stops. I can’t confirm that, and neither can anyone working from public trades. The tape records that aggressive selling happened. It doesn’t record who sent it.
Where Liquidity Sweeps Happen in Crypto
Every guide lists roughly the same levels. Crypto adds a few twists:
- The day’s low and high. Crypto trades 24/7, so “the day” is a choice. Most charting and exchange data use the 00:00 UTC boundary, which is the convention we use here.
- The previous day’s high and low (PDH and PDL). These are among the most watched levels on any intraday chart. Our PDH/PDL bounce strategy guide covers why traders place orders around them.
- Swing highs and lows, and equal highs or lows. A double bottom is two lows with stops stacked under both.
- Round numbers. $100 on SOL, $80,000 on BTC.
- Crowded perpetual futures positions. Perps add a second source of forced orders. On Hyperliquid, for example, when an account falls below maintenance margin, the protocol first tries to close the position by sending market orders to the book. A break through a level where many leveraged longs sit can trigger stops and liquidations together, which helps explain why some crypto sweeps run deeper than the stop cluster alone would suggest.
Want to watch these breaks across every market instead of one chart? AnomIQ flags a New UTC-Day Low or New UTC-Day High on every tracked market on 5m, 15m and 60m windows. Open the scanner and filter for them.
Liquidity Sweep vs Liquidity Grab vs Stop Hunt
The vocabulary is messy, and no two guides draw the lines in quite the same place. Roughly:
| Term | Usual meaning | What it implies |
|---|---|---|
| Liquidity sweep | Price trades through a level, triggers the orders beyond it, and returns | A description of price behavior |
| Liquidity grab | Often used interchangeably; some sources reserve it for a shorter, sharper wick | The same event, faster |
| Stop hunt | The same event, framed as deliberate | An intent claim that public data can’t verify |
| Swing failure pattern (SFP) | Price breaks a swing high or low and closes back inside on the same or next candle | The candlestick version of a sweep |
| Liquidity run / breakdown | Price trades through the level and keeps going | The opposite outcome |
Don’t get stuck on the labels. They all come down to one question: did price reject the level or accept beyond it? The awkward part, as the next section shows, is that you only find out after the break.
Can You Tell a Liquidity Sweep From a Breakdown at the Break? I Tested It
Most guides say you can confirm a valid liquidity sweep with volume, order flow or open interest. I wanted to see whether that holds up in real crypto data. So I wrote the definitions down before looking at any results, then ran them over AnomIQ’s minute-level archive.
How I tested it
- Data: AnomIQ’s archive of Binance USDⓈ-M and Hyperliquid perpetual futures, September 18 to October 8, 2026, one row per market per minute. 9,798 events qualified: 8,274 on Binance across 511 markets and 1,524 on Hyperliquid across 97.
- The level: the day’s lowest one-minute close since 00:00 UTC, and it had to stay unbroken for at least 60 minutes. That’s a low traders had time to notice and put stops under.
- The break: the first one-minute close below that level, reaching 0.1% to 3% below it within 15 minutes, with a burst of selling unusual for that coin: a 5-minute Sell Volume Z-score of 2 or more within three minutes of the break. Thin markets were excluded (Liquidity Score below 80, or under $2 million traded the day before).
- The outcome: reclaim if price closed back above the level within 30 minutes and didn’t close below the sweep’s low for the next hour. Breakdown if it never closed back above within 60 minutes. Everything else counts as mixed.
The archive stores the last price of each minute, not intra-minute highs and lows, so these depths are conservative. The results:
| Outcome | Share of 9,798 breaks |
|---|---|
| Reclaim (a sweep) | 38.9% |
| Breakdown | 18.3% |
| Mixed (back and forth around the level) | 42.8% |
The median reclaim came back above the level within 5 minutes.
Order flow at the break looked the same
For every event I recorded what a trader could have seen by the time of the break, then checked whether those readings told the eventual sweeps apart from the eventual breakdowns. The separation score below measures exactly that: 0.5 is a coin flip, 1.0 is perfect separation.
| Reading at the break | Median, reclaims | Median, breakdowns | Separation score |
|---|---|---|---|
| Net Taker Imbalance (5m) | -41.7 | -42.6 | 0.46 to 0.54 |
| Relative Price Impact (5m) | 0.224 | 0.208 | 0.49 to 0.53 |
| Sell Volume Z-score (5m, peak in first 3 minutes) | 6.50 | 7.98 | 0.44 to 0.46 |
| Open interest change (5 min before to 1 min after) | -0.051% | -0.045% | 0.49 to 0.52 |
The score ranges cover both exchanges and both halves of the period. None comes close to useful. The one consistent lean ran the “wrong” way: breakdowns started with bigger sell bursts, not smaller ones. Open interest fell in about 70% of breaks in both groups, which says positions were closing either way, through stops, liquidations or profit-taking.
That matches a separate AnomIQ study. Across 16,726 extreme order-flow events on 39 Binance perpetuals in 2025, the direction price took over the next 12 hours wasn’t encoded in the event itself. A burst of one-sided flow tells you something unusual is happening, not which way it resolves.
What changed after the break
The difference showed up later, with the outcome itself. Fifteen minutes after the break, median 5m Net Taker Imbalance was +5.5 for reclaims and -9.8 for breakdowns. When price came back above the level, aggressive buying came with it.
So the flow does turn. It turns with the reclaim, though, not ahead of it, which makes it confirmation rather than a forecast. The reclaim is the thing to wait for.
“Market-wide drops are just noise”: the opposite showed up
This one was my idea, and it’s a common rule: when BTC and everything else drop together, a coin breaking its low is just riding the market, so the real sweeps should be the coin-specific ones. I wrote it down as a hypothesis before testing it on September 18 to October 1, data no test had seen yet. It failed, and it went the other way:
| Break context (Binance, September 18 to October 1) | Breaks | Reclaimed | Broke down |
|---|---|---|---|
| Coin-specific: BTC down less than 0.15% (or up) over 15 minutes, 3 or fewer other markets breaking | 1,231 | 37.5% | 16.9% |
| Market-wide: BTC down 0.3% or more over 15 minutes, or 15+ markets breaking | 2,778 | 45.9% | 13.1% |
The 8.4-point gap held up in a bootstrap that resamples whole days (95% interval: 1.2 to 15.5 points). Hyperliquid, over the same weeks, showed the same direction: 53.3% vs 38.1%. (In the October 2 to 8 week used to design the test, Hyperliquid leaned the other way, within the noise.)
My best guess at why: a market-wide flush is mostly forced selling everywhere at once, and when it stops, the bounce lifts everything together. A coin breaking its low on its own may have a reason to keep falling. I came up with that after seeing the numbers, though, so it’s a lead to check, nothing more.
The flushes are easy to spot in the raw data. At 18:30 UTC on October 2, 99 markets broke qualifying day lows inside the same 15 minutes. Forty of those breaks reclaimed and 46 broke down: in a single market-wide moment, the outcomes still split almost evenly.
Yesterday’s POC and value area made no difference
My second idea was that a day low sitting on one of yesterday’s volume levels would behave differently. The levels were the previous day’s Point of Control or the edge of its value area, within 0.3%. Reclaim rates on Binance from September 18 to October 1 were 39.7% at a prior-day level and 41.2% away from one. That’s inside the noise, and a looser 0.5% band changed nothing.
Base rates move with the market
The overall split isn’t a constant. On Binance, 41.5% of breaks reclaimed from September 18 to October 1, against 32.6% from October 2 to 8, while breakdowns rose from 15.8% to 24.1%. Any “X% of sweeps reverse” figure you read online is a snapshot of one market regime.
Limits of this test
Three weeks of data, one stretch of market conditions, one-minute closes, and my own rules for level, break and outcome. Events cluster in time, so they aren’t independent.
This describes what price did. It isn’t a backtest, and it says nothing about whether trading these breaks makes money. Same standard as my earlier short squeeze pattern test across 39 symbols: publish what didn’t work alongside what did.
A Real Liquidity Sweep Example, Minute by Minute
Two events from the same dataset, picked because they looked alike at the break and ended in opposite ways. Prices and volumes come from Binance one-minute candles. The order-flow readings come from AnomIQ’s archive.
Example 1: SOL sweeps its daily low and reclaims it
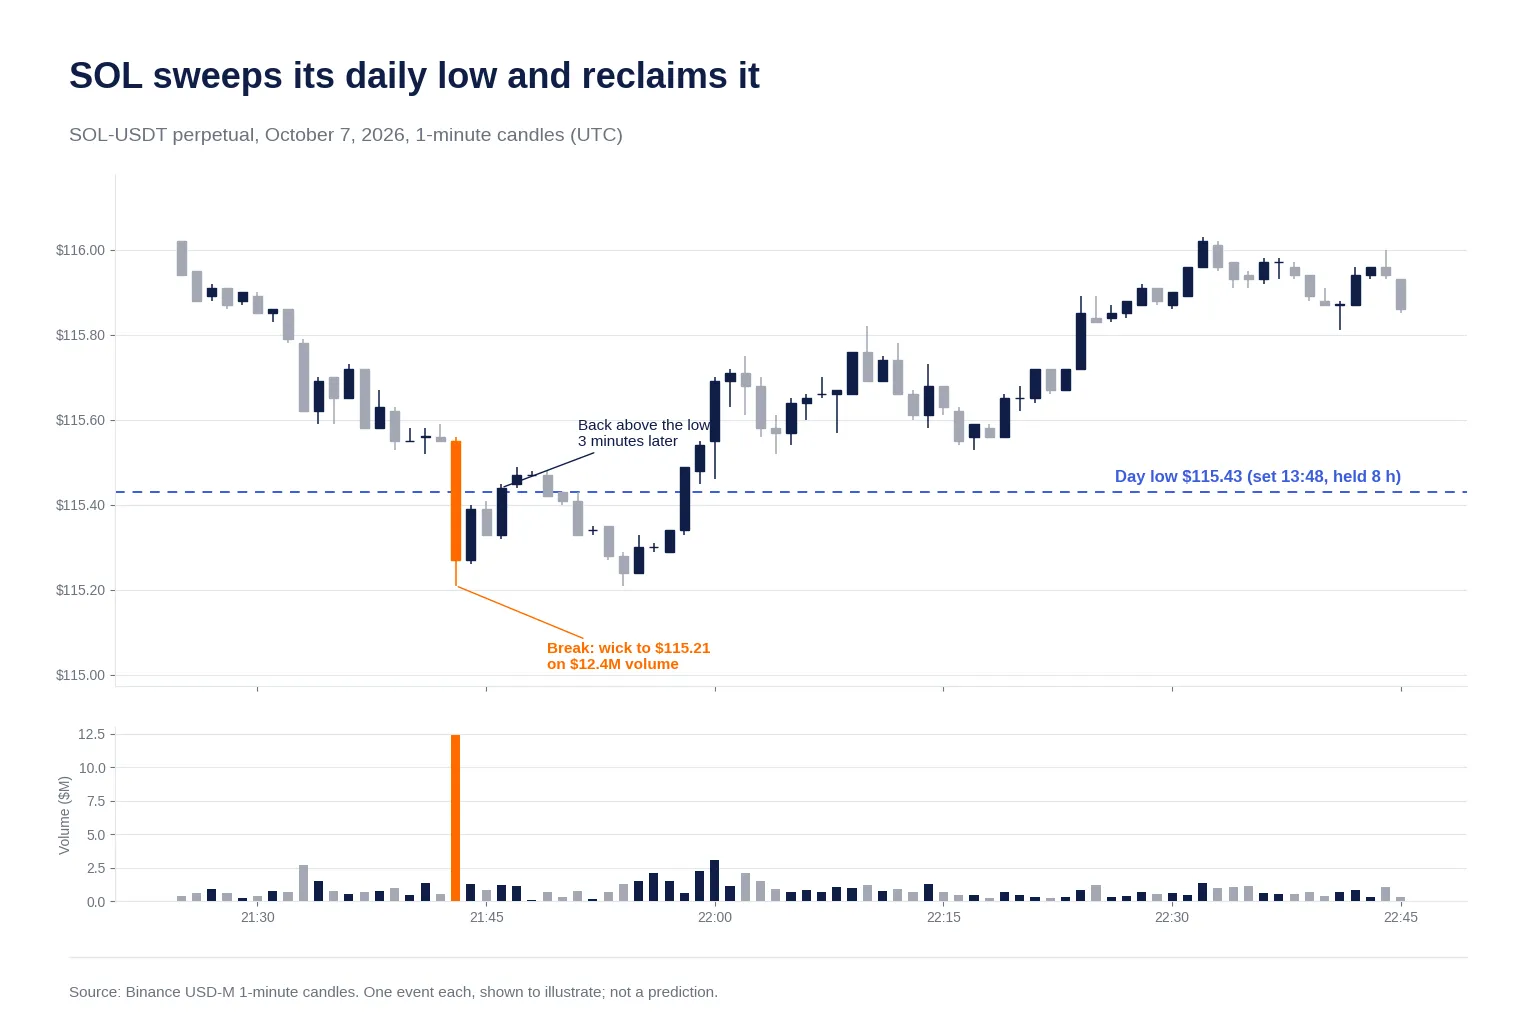
On October 7, 2026, SOL-USDT perpetual futures set the day’s low at $115.43 at 13:48 UTC. It held for eight hours.
At 21:43 UTC, a single one-minute candle wicked to $115.21, 0.19% below the low, on $12.4 million of volume. The minutes just before had traded $0.5 to $1.4 million each. At the break, 5m Sell Volume Z-score peaked at 10.8, Net Taker Imbalance read -53 and Relative Price Impact 0.058.
By 21:46, price had closed back above $115.43. It retested $115.21 at 21:54 without going lower, and an hour after the break it traded at $115.96. Fifteen minutes after the break, 5m Net Taker Imbalance read +48.
Example 2: BTC breaks its daily low and keeps going
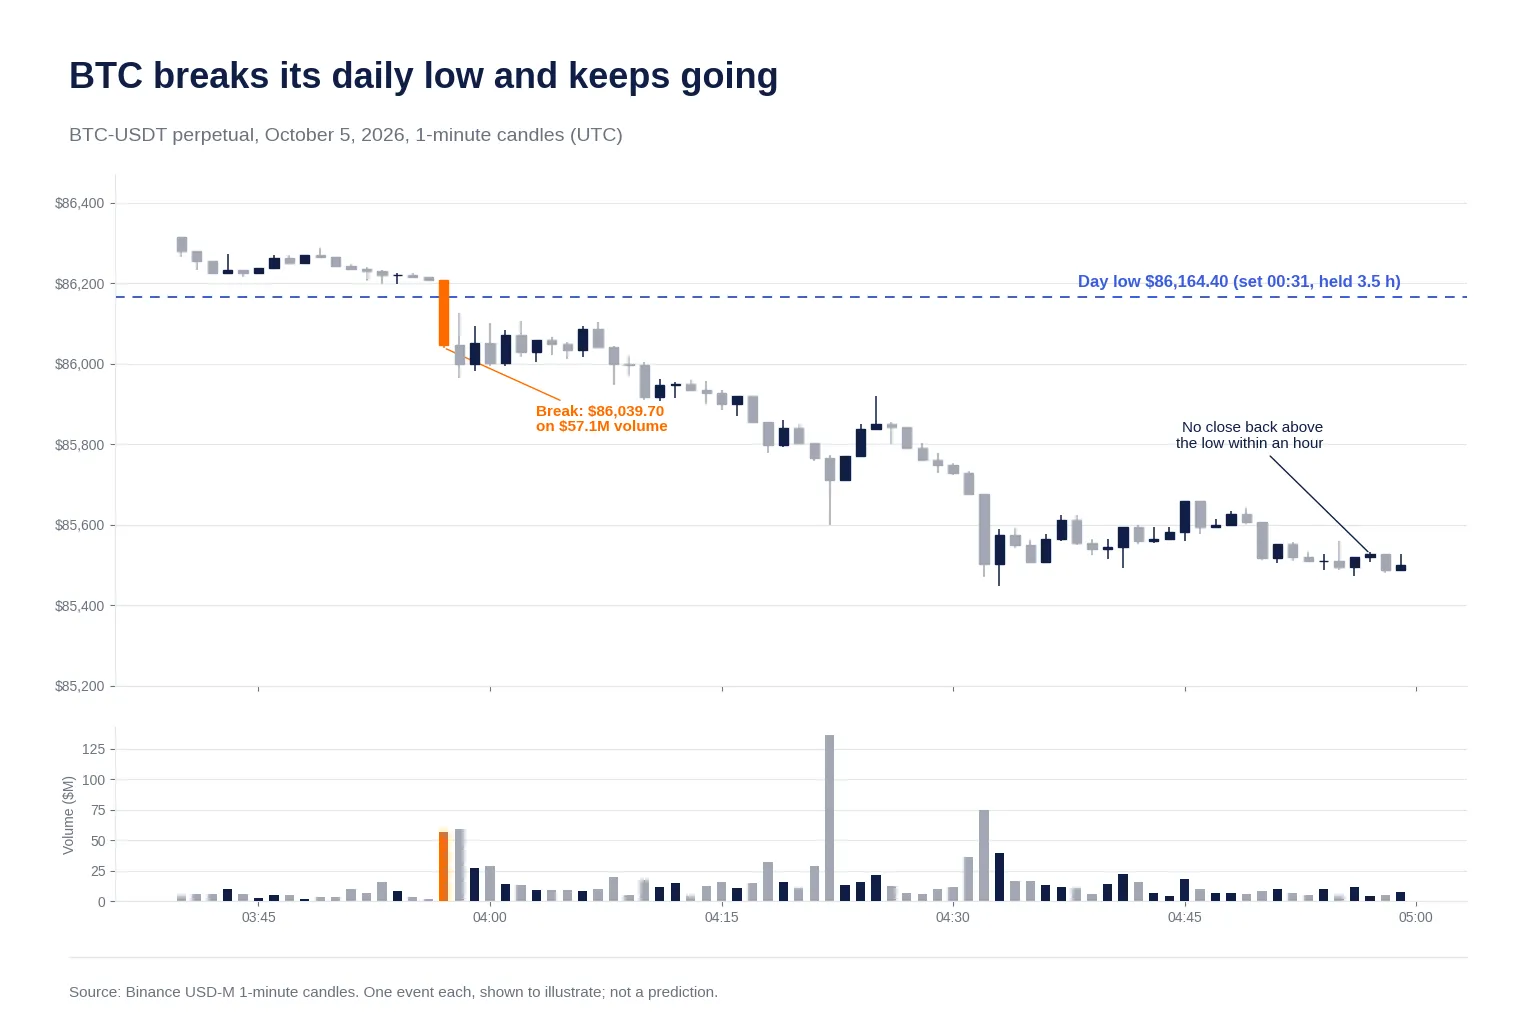
On October 5, 2026, BTC-USDT perpetual futures set the day’s low at $86,164.40 at 00:31 UTC. It held for about three and a half hours.
At 03:57 UTC, a one-minute candle broke it to $86,039.70 on $57.1 million of volume, against $1.8 to $8.6 million in the minutes before, and the next minute traded another $59.5 million. At the break, 5m Sell Volume Z-score peaked at 11.3, Net Taker Imbalance read -45 and Relative Price Impact 0.068.
BTC never closed back above the level within the hour. It made lower lows to $85,906.80 by 04:11, and an hour after the break it traded at $85,528.10, 0.74% below the old low. Fifteen minutes after the break, 5m Net Taker Imbalance read -25.
| At the break | SOL, October 7, 21:43 UTC | BTC, October 5, 03:57 UTC |
|---|---|---|
| Day low held for | 8 hours | 3.5 hours |
| Sell Volume Z-score (5m) | 10.8 | 11.3 |
| Net Taker Imbalance (5m) | -53 | -45 |
| Relative Price Impact (5m) | 0.058 | 0.068 |
| One hour later | Reclaimed, +0.46% | Broke down, -0.74% |
Side by side, they make the problem with “spot the valid sweep” hard to ignore. Both started with a long-held low, a volume burst many times the normal minute, and nearly identical order-flow readings. Three minutes in, SOL was back above its level. BTC never got back.
To see these readings on any market when an alert fires, the Deep Dive shows the rolling order-flow metrics and their recent history. Open AnomIQ and check the next one live.
How to Scan for Liquidity Sweeps Across Every Market
If the break doesn’t tell you anything, there’s no point asking a scanner to call it. The useful job is narrower: find the breaks where a reclaim is already underway, on every market at once, while they’re happening rather than on a chart afterwards.
A starting filter for a sell-side sweep that’s turning:
New UTC-Day Low (15m) = true
AND Sell Volume Z-score (15m) >= 2
AND Current (TimeFrame) Return (5m) >= 0.1
AND Net Taker Imbalance (5m) >= 20
AND Liquidity score 0-100 >= 80
AND Today Volume in $ >= 500000
Read it as: a fresh day low inside the last 15 minutes, a sell burst unusual for this coin, and in the last 5 minutes price rising with buyers in control. The Volatility Z-Score and Current (TimeFrame) Return pages explain why these are judged against each coin’s own history rather than a fixed percentage. The same filter works on BTC and a mid-cap.
I haven’t tested this filter as a trading strategy. Use it to find breaks worth a look. It doesn’t check how long the low held, and it can’t see swing lows, equal lows or round numbers, which need a chart. To catch buy-side sweeps, mirror it: New UTC-Day High, a Buy Volume Z-score burst, a negative 5m return and Net Taker Imbalance of -20 or lower.
Real-time alerts are on the paid plan. On the free tier, the same matches arrive 30 minutes late. That’s enough to study sweeps after the fact, but not to act on a reclaim that happens within 5 minutes.
Trading Around a Liquidity Sweep: Entries, Stops and Mistakes
CAUTION
This section describes how traders commonly structure sweep setups. It isn’t trading advice. A scanner alert is a reason to investigate a market, not an instruction to enter a position.
If the data says one practical thing, it’s this: wait for the reclaim. In the tested sample, the break alone told you close to nothing. A close back above the level was what defined a sweep. Traders who use the setup typically enter after price closes back above the level, and place the stop below the sweep’s extreme, not just below the level. A stop parked right under the level is exactly what the sweep takes out.
That’s also why a sweep doesn’t fit every support strategy. In our daily bounce system, the stop sits just beyond the tested level, and position size depends on trend and confluence. A sweep trades through that stop. If you trade both, treat the reclaim of a swept level as its own setup with its own stop.
Common mistakes:
- Calling every wick a sweep. About 43% of tested breaks did neither cleanly: they came back late, or reclaimed the level and then lost it again.
- Entering at the break. That’s buying a coin flip, by the data above.
- Assuming market-wide drops don’t count. In this window, they reclaimed more often than coin-specific breaks.
- Reading “sweeps” on thin markets. Where trading is patchy, a handful of trades can print a wick. A minimum Liquidity Score filters these out.
For a deeper look at what happens when aggressive flow meets passive orders at a level, see absorption vs exhaustion in order flow.
FAQ
What is a liquidity sweep in trading?
A liquidity sweep is a fast move through a price level where stop orders cluster, usually a prior high or low, that triggers those stops and then returns back inside the level. The stops become market orders as price passes through them; when that selling or buying gets absorbed, price reclaims the level.
What is buy-side and sell-side liquidity?
Buy-side liquidity sits above highs: stop-loss orders of short sellers and breakout buy orders, which execute as market buys when price trades through. Sell-side liquidity sits below lows: stop-loss orders of long holders and breakout sell orders, which execute as market sells.
What’s the difference between a liquidity sweep, a liquidity grab and a stop hunt?
In practice the three terms describe the same event: price runs through a level where stops sit, triggers them, and returns. Sources disagree on the fine distinctions. What matters for a trader is whether price rejected the level (it came back) or accepted beyond it (it kept going).
How do you tell a liquidity sweep from a real breakout or breakdown?
In our test of 9,798 day-low breaks on crypto perpetuals, you couldn’t at the moment of the break: taker flow, price impact and open interest looked the same for sweeps and breakdowns. The usable evidence came afterwards, when price closed back above the level and taker flow turned with it.
Is there a liquidity sweep indicator?
Indicators can mark when price trades beyond a prior high or low and closes back inside, but none can know in advance whether it will come back. A scanner is most useful for finding breaks where a reclaim is already underway, across every market at once.
Do liquidity sweeps work the same way in crypto as in forex?
The mechanism is the same, but crypto trades 24/7, so day levels follow the UTC day. Perpetual futures add liquidations, which close positions with market orders, so a sweep through a crowded level can extend further than the stop orders alone would push it.
Conclusion
A liquidity sweep is easy to define and hard to call in real time:
- It’s a run through the stops beyond an obvious level, followed by a return inside it.
- In 9,798 crypto day-low breaks, the sweeps and the breakdowns looked the same at the break on every order-flow reading I checked.
- Two popular filters didn’t hold up: market-wide drops reclaimed more often than coin-specific ones, and yesterday’s POC under the level made no measurable difference.
- The reclaim, with taker flow turning after it, is the evidence. Everything before it is a guess.
I started this expecting to publish a checklist for spotting valid sweeps. The data didn’t support one. What it supports is less exciting and more useful: watch every break as it happens, across every market, and pay attention to the ones that turn.
Open AnomIQ and build the sweep-and-reclaim filter above. Then check the next alert in the Deep Dive and watch whether the flow turns with the reclaim.